python3 自编线性回归(4种方法)
1、数据准备:
import numpy as np

x = np.array([0, 1, 2, 3])
y = np.array([-1, 0.2, 0.9, 2.1])
X, Y = x, y
2、直线回归方程,适用于一元线性回归
# 直线回归方程求解(y=bx+a+e)

def regressgion(x, y):
    x_mean = np.mean(x)
    y_mean = np.mean(y)
    SP = sum(((x[i] - x_mean) * (y[i] - x_mean) for i in range(len(x))))
    SS_x = sum(((x[i] - x_mean) ** 2 for i in range(len(x))))
    b = SP / SS_x
    a = y_mean - b * x_mean
    return b, a

b, a = regressgion(x, y)
计算方法参考:直线回归和相关------(一)回归和相关的概念与直线回归(含最小二乘推导)(https://blog.csdn.net/mengjizhiyou/article/details/82078797)
3、矩阵求解,一元多元线性回归均可用
# 直线回归矩阵求解(y=b0+b1*X+e)

def regression(X, Y):
    Y = Y.T
    X = np.vstack([np.ones(len(X)), X]).T
    coef = np.mat(np.dot(X.T, X)).I * np.mat(np.dot(X.T, Y)).T
    b0, b1 = round(float(coef[0]), 2), round(float(coef[1]), 2)
    return b0, b1  # -0.95, 1

b0, b1 = regression(X, Y)
计算方法参考:直线回归和相关------(三)直线回归的矩阵求解以及公式推导(https://blog.csdn.net/mengjizhiyou/article/details/82120184)
4、调用numpy,一元多元线性回归均可用
# 调用np.linalg.lstsql

A = np.vstack([x, np.ones(len(x))]).T
m, c = np.linalg.lstsq(A, y, rcond=None)[0]  # m=1,c=-0.95
5、调用sklearn,一元多元线性回归均可用,自变量一维时注意x的数据格式
# 调用sklearn

from sklearn.linear_model import LinearRegression

# Reshape your data either using array.reshape(-1, 1) if your data has a single feature
# or array.reshape(1, -1) if it contains a single sample.
reg = LinearRegression().fit(x.reshape(-1, 1), y)
slope = reg.coef_[0]  # reg.coef_为数组
intercept = reg.intercept_
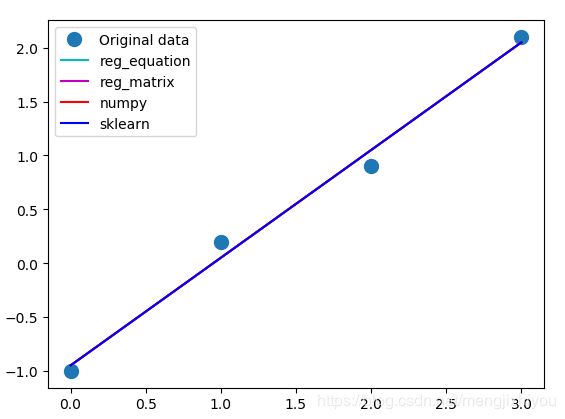
6、将4种线性回归的图进行比较,4条线重合
# 绘图比较

import matplotlib.pyplot as plt

_ = plt.plot(x, y, 'o', label='Original data', markersize=10)
_ = plt.plot(x, b * x + a, 'c', label='reg_equation')
_ = plt.plot(x, b0 + b1 * x, 'm', label='reg_matrix')
_ = plt.plot(x, m * x + c, 'r', label='numpy')
_ = plt.plot(x, slope * x + intercept, 'b', label='sklearn')
_ = plt.legend()
plt.show()
plt.close()