声明:由于本人也是处于学习阶段,有些理解可能并不深刻,甚至会携带一定错误,因此请以批判的态度来进行阅读,如有错误,请留言或直接联系本人。
本周内容参照Jiawei.Han&Micheline.Kamber&Jian.Pei, DATA MINING: Concepts and Techniques, Third Edition. 版本的部分内容。
本周内容:1) Logical Model; 2) Query Language; 3) Physical Model and Query Processing Technologies; 4) Materialized Cuboids and Efficient Computing Cuboids
关键词:Star Schema; Snowflake Schema; Fact Collection; Normalization; Denormalization; SQL; MDX; ROLAP; MOLAP; Bitmap; Join Index; Arbitrary selections; Coarse-grain Aggregations; Top-down Approach; Bottom-up Approach
问题一,什么是Logical Model?它的实现方式有哪些?
什么是Logical Model(Logical Data Model)?
Wikipedia解释:A logical data model or logical schema is a data model of a specific problem domain expressed independently of a particular database management product or storage technology (physical data model) but in terms of data structures such as relational tables and columns, object-oriented classes, or XML tags.
Data Warehouse的Logical Model有两种主要实现方式:
1)relational DB technology:
1.1)Star schema,
1.2)Snowflake schema,
1.3)Fact constellation
2)multidimensional technology:
2.1)Just as multidimensional data cube
问题二,什么是Star schema?
Star schema: The most common modeling paradigm is the star schema, in which the data warehouse contains (1) a large central table (fact table) containing the bulk of the data, with no redundancy, and (2) a set of smaller attendant tables (dimension tables), one for each dimension. The schema graph resembles a starburst, with the dimension tables displayed in a radial pattern around the central fact table.(DATA MINING P.114)
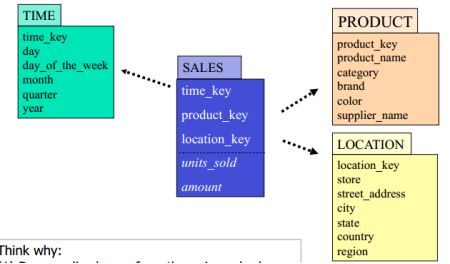
在这里,SALES是Fact Table, 其他的是Dimension Table。
那么这里的star schema是怎么由universal schema转变过来的呢?
其实这里的star schema是由universal schema经过normalization转化而来,具体有:
1)Each dimension is represented by a dimension-table
1.1)LOCATION (location_key, store, street_address, city, state, country, region)
1.2)dimension tables are not normalized
2)Transactions are described through a fact-table
2.1)each tuple consists of a pointer to each of the dimension-tables (foreign-key) and a list of measures (例如上图中的,units_sold; amount)
使用Star schema有什么好处呢?
Facts and dimensions are clearly depicted
1)dimension tables are relatively static, data is loaded (append mostly) into fact table(s)
2)easy to comprehend (and write queries)
问题三,什么是Snowflake schema?
Snowflake schema: The snowflake schema is a variant of the star schema model, where some dimension tables are normalized, thereby further splitting the data into additional tables. The resulting schema graph forms a shape similar to a snowflake.(DATA MINING P.114)
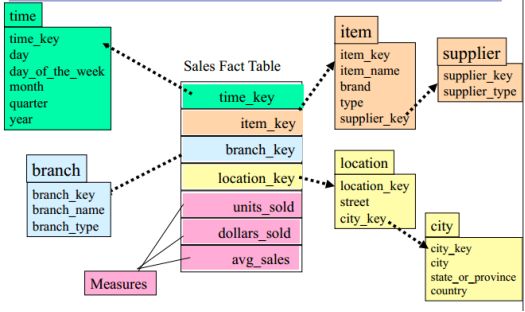
因此,我们可知,Snowflake schema只要经过Denormalization就可以变回Star schema.
问题四,什么是Fact Collection?
Fact constellation: Sophisticated applications may require multiple fact tables to share dimension tables. This kind of schema can be viewed as a collection of stars, and hence is called a galaxy schema or a fact constellation.(DATA MINING P.116)
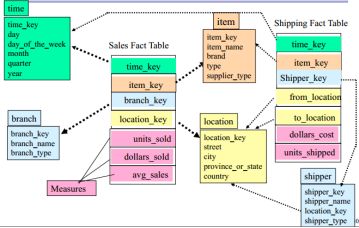
由上图可以得到Fact Collection是由多个fact table共享它们相同的dimension table 的内容,可以达到降低冗余的需求。
名词解释:
Normalization:Database normalization, or simply normalization, is the process of restructuring a relational database in accordance with a series of so-called normal forms in order to reduce data redundancy and improve data integrity. Normalization entails organizing the columns (attributes) and tables (relations) of a database to ensure that their dependencies are properly enforced by database integrity constraints. It is accomplished by applying some formal rules either by a process of synthesis (creating a new database design) or decomposition (improving an existing database design).(Wikipedia)(Tips:可以思考relational database中的1NF->2NF->3NF等等的转换)
为什么要在relational database中使用normalization呢?
1)节省空间。例如,street1:Bark Street;City1:Kingsford;Stae1:NSW。Street2:Harry stree;City1:Kingsford;Stae1:NSW。纳闷我们将City进行normalization,即city_key指向city、stae,然后我们不同的street就可以共用这一city_key,以达到减少redundancy的目的。
2)便于update。任然是上面的例子,如果Bark Street现在划归为Randwick,那么只需要将city_key的指向指为Randwick所属的那个city_key就可以了。
Denormalization:Denormalization is a strategy used on a previously-normalized database to increase performance. In computing, denormalization is the process of trying to improve the read performance of a database, at the expense of losing some write performance, by adding redundant copies of data or by grouping data.[1][2] It is often motivated by performance or scalability in relational database software needing to carry out very large numbers of read operations. Denormalization should not be confused with Unnormalized form. Databases/tables must first be normalized to efficiently denormalize them.(Wikipedia)
还可参照以下更为通俗的解释:https://medium.com/@katedoesdev/normalized-vs-denormalized-databases-210e1d67927d
问题五,Data Warehouse的query language 有哪些?
1)Using relational DB technology: SQL (with extensions such as CUBE/PIVOT/UNPIVOT)
2)Using multidimensional technology: MDX
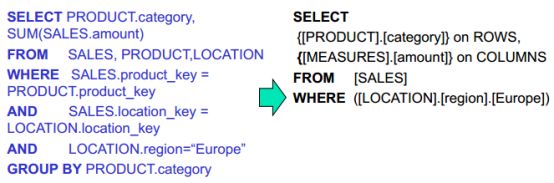
上图中,左边的是SQL,右边的是MDX。相较而言,MDX更为简单,因为它的语句更加直观简洁。它们所共同表达的意思就是:Operations: Slice (Loc.Region.Europe) + Pivot (Prod.category, Measures.amnt)
问题六,Data Warehouse 的层次结构模型有什么?
Data Warehouse architecture分为3层:1)最底层,Data Warehouse Server; 2)中间层,OLAP Server; 3)最高层,Front-end Tools
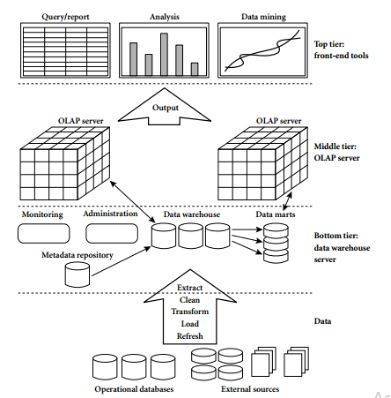
我们着重介绍中间层:OLAP Server。
OLAP Server主要采用两种方式:
1)ROLAP(which is used in relational database technology)
2)MOLAP(which is used in multidimensional technology)
还有一种混合的OLAP Server,HOLAP
Relational OLAP (ROLAP) servers: These are the intermediate servers that stand in between a relational back-end server and client front-end tools. They use a relational or extended-relational DBMS to store and manage warehouse data, and OLAP middleware to support missing pieces. ROLAP servers include optimization for each DBMS back end, implementation of aggregation navigation logic, and additional tools and services. ROLAP technology tends to have greater scalability than MOLAP technology. The DSS server of Microstrategy, for example, adopts the ROLAP approach.(DATA MINING P.135)
Multidimensional OLAP (MOLAP) servers: These servers support multidimensional views of data through array-based multidimensional storage engines. They map multidimensional views directly to data cube array structures. The advantage of using a data136 Chapter 3 Data Warehouse and OLAP Technology: An Overview cube is that it allows fast indexing to precomputed summarized data. Notice that with multidimensional data stores, the storage utilization may be low if the data set is sparse. In such cases, sparse matrix compression techniques should be explored (Chapter 4). Many MOLAP servers adopt a two-level storage representation to handle dense and sparse data sets: denser subcubes are identified and stored as array structures, whereas sparse subcubes employ compression technology for efficient storage utilization.(DATA MINING P.135)
Hybrid OLAP (HOLAP) servers: The hybrid OLAP approach combines ROLAP and MOLAP technology, benefiting from the greater scalability of ROLAP and the faster computation of MOLAP. For example, a HOLAP server may allow large volumes of detail data to be stored in a relational database, while aggregations are kept in a separate MOLAP store. The Microsoft SQL Server 2000 supports a hybrid OLAP server.(DATA MINING P.136)

例如上图,就是利用HOLAP来进行数据存放及处理,base cuboid我们可以理解为star schema中的fact table,它使用ROLAP来进行存储处理,因为relational database query更加方便;然而下面的可以用MOLAP来进行存储处理,这样使得数据存储更加立体,索引起来更加方便。
问题七,当我们我们针对OLAP中不同数据情况时,我们该采用何种所应方式来方便query呢?
1)Selection on low-cardinality attributes,Bitmap Index(BI)是个不错的选择。
BI on dimension tables
1.1) Index on an attribute (column) with low distinct values
1.2) Each distinct values, v, is associated with a n-bit vector (n = #rows)
1.2.1) The i-th bit is set if the i-th row of the table has the value v for the indexed column
1.3) Multiple BIs can be efficiently combined to enable optimized scan of the table
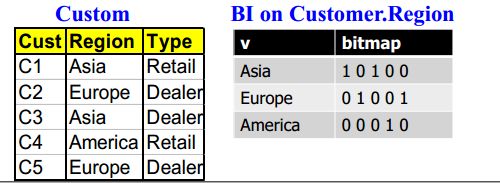
这里将region作为”distinct values”,在Asia行时,读出C1,C3的Region为Asia,所以bitmap 的第1,3列表为1。以此类推。如果需要加入新元素,C6,C7,C8......Cn,则只需要将bitmap后面增加n-5个column即可。(记住,data warehouse一般只能增加数据,一般不可删除修改数据或)
Bitmap的优点:1)提高存储空间利用率;2)提高运行速率
2)Selection on high-cardinality attributes,Join Indices是个不错的选择
2.1)Join index relates the values of the dimensions of a star schema to rows in the fact table.
2.1.1)a join index on city maintains for each distinct city a list of ROW-IDs of the tuples recording the sales in the city
2.2)Join indices can span multiple dimensions OR
2.2.1)can be implemented as bitmap indexes (per dimension)
2.2.2)use bit-op for multiple-joins
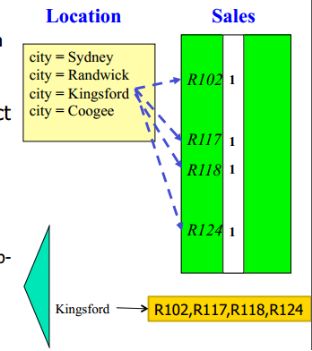
我们可以将Kingsford在fact table Sales中的Row ID记录在Kingsford的join index table(黄色区域)下,以方便我们索引Kingsford ;同时,还可以为Time中的year= ‘2017’建立join index table。假如,Kingsford join index table[R102, R117, R118, R124], ‘2017’join index table[R111, R117, R 119, R124],那么当我们需要查找位于Kingsford 的2017年的sales数据则可以索引join index table得到R117和R124符合条件。
3)Arbitrary selections on Dimensions
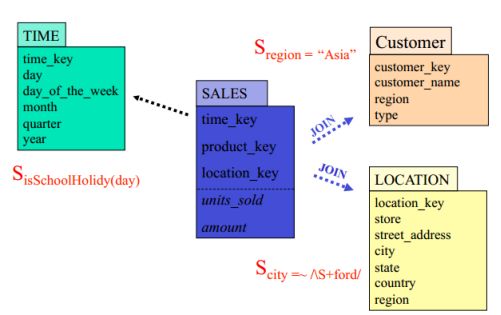
可以使用正则来筛选。
(以下是Relational Database 和 Data Warehouse之间的数据检索的差别)
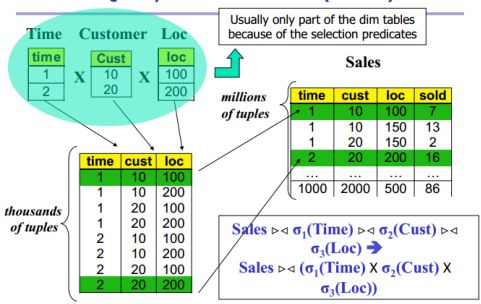
上面的语句就是Query,与traditional relational DB相同,Sales与select出来的Time相join,然后和select出来的Time相join,然后和select出来的Time相join。请注意,这里的join只能是binary combine,而且是fact table with dimension table only(因为dimension table间没有common foreign key,因此无法combine,然而fact table中存储了所有的foreign key)。(binary combine比较耗费时间。)

在Data Warehouse中我们使用上面star join这种方法,先将select出的Time, Customer, Loc进行Cross Join生成笛卡儿积,再join fact table(因为fact table太大了所以最后join)。例如例子所给,我们将select出的3组数据cross join得到8个tuple,然后得到找出想要的2个tuple,接着通过scan fact table中的数据来对比出符合这2个tuple中3个foreign key的tuples(fact table中的tuples)。这样做相较于star query,只需要再最后join fact table,而再star query中,需要在3次join中与fact table相join,因此star join更加高效。
4)Coarse-grain Aggregations
我们将Time聚合为Year,customer聚合为Type,Loc聚合为City,以此来形成一个Cuboid,方便。当然,需要根据实际情况需求来形成cuboid。
问题八,How to store the materialized cuboids? How to compute the cuboids efficiently?
有4种方式:
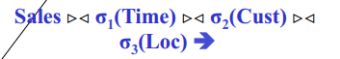
1)ROLAP(Store all data into one single table)
当需要用到某些cuboids来应对query时,可以使用selection语句进行查询(这里的(store, product), (store), (product),()都是独立的cuboid)。
2)Top-down Approach

在这里,晶格图中最上层是所有dimension的detail,往下走是一步步group by。例如A是product,B是quarter,那么Cuboid AB表示(product, quarter), Cuboid A表示第三层的(product),Cuboid B表示第三层的(quarter). Cuboid A中,是以product为Group by的,所以tuple1(A: 1; B: 7; C: 100), tuple2(A: 2; B: 4; C: 50)。所以group by和computing是从顶向下的。
3)Bottom-up Approach

自底向上,从A, B, C, D各自group by,再到AB等等间group by直到最后达到ABCD聚合。
这里介绍的计算方式是Recursive,具体见PPT60
4)MOLAP
详见PPT69