序章
- GWAS全基因组关联分析,近年来一直为研究的热点,不管是研究复杂疾病或是遗传育种,均有广泛的用途。但是GWAS的数据动辄上千的样本数据,如何对这庞大的数据进行分析?于是就有了一个强大的分析工具--PLINK。
- 主要的功能模块包括:数据处理,质量控制的基本统计,群体分层分析,单位点的基本关联分析,家系数据的传递不平衡检验,多点连锁分析,单倍体关联分析,拷贝数变异分析,Meta分析等等。
- 全基因组关联分析 GWAS (Genome-wide association study;GWAS):应用基因组中数以百万计的单核苷酸多态;SNP为分子遗传标记,进行全基因组水平上的对照分析或相关性分析,通过比较发现影响复杂性状的基因变异的一种新策略。
- GWAS的基本原理: 借助于SNP分子遗传标记,进行总体关联分析,在全基因组范围内选择遗传变异进行基因分析,比较异常和对照组之间每个遗传变异及其频率的差异,统计分析每个变异与目标性状之间的关联性大小,选出最相关的遗传变异进行验证,并根据验证结果最终确认其与目标性状之间的相关性。
1 .ped 格式
- ped文件包含了基因型信息,每一行为一个样本
- ped 有7列
| Family ID | Individual ID | Paternal ID | Maternal ID | Sex | Phenotype | Genotypes |
|---|---|---|---|---|---|---|
| 家族ID | 个人ID | 父亲ID | 母亲ID | 性别 | 表型 | 基因型 |
- Sex (1=male; 2=female; other=unknown)
- Phenotype (1 = case; 2 = control)
- 7以后是基因型,可以有很多列,但基因型必须是成对存在的。
# 举例
FAM001  1  0 0  1  2  A A  G G  A C
HCB181  1  0 0  1  1  2 2  2 2  2 2
2 .map 格式
- MAP文件主要是用来记录每个maker(一般为SNP)的位置信息。
- map有4列
| chr | snp identifier | morgans | bp units |
|---|---|---|---|
| 染色体 | snp标识 | 基因距离 | 碱基距离 |
# 举例
1  rs0   0   1000
1  rs10  0   1001

image.png
2. 基本plink 命令

image.png
具体参考: http://zzz.bwh.harvard.edu/plink/
3. 质量控制步骤
- 一般分7步
(1) individual and SNP missingness, (snp 缺失)
(2) inconsistencies in assigned and genetic sex of subjects (see sex discrepancy), (性别是否出错)
(3) minor allele frequency (MAF), (MAF 频率筛选)
(4) deviations from Hardy–Weinberg equilibrium (HWE), (哈代平衡测试)
(5) heterozygosity rate, (杂合率)
(6) relatedness, and (相关性)
(7) ethnic outliers (see population stratification). (人口分层) - Overview of seven QC steps that should be conducted prior to genetic association analysis
| Step | Command | Function | Thresholds and explanation |
|---|---|---|---|
| 1: Missingness of SNPs and individuals | ‐‐geno | Excludes SNPs that are missing in a large proportion of the subjects. In this step, SNPs with low genotype calls are removed. | We recommend to first filter SNPs and individuals based on a relaxed threshold (0.2; >20%), as this will filter out SNPs and individuals with very high levels of missingness. Then a filter with a more stringent threshold can be applied (0.02).Note, SNP filtering should be performed before individual filtering. |
| ‐‐mind | Excludes individuals who have high rates of genotype missingness. In this step, individual with low genotype calls are removed. | ||
| 2: Sex discrepancy | ‐‐check‐sex | Checks for discrepancies between sex of the individuals recorded in the dataset and their sex based on X chromosome heterozygosity/homozygosity rates. | Can indicate sample mix‐ups. If many subjects have this discrepancy, the data should be checked carefully. Males should have an X chromosome homozygosity estimate >0.8 and females should have a value <0.2. |
| 3: Minor allele frequency (MAF) | ‐‐maf | Includes only SNPs above the set MAF threshold. | SNPs with a low MAF are rare, therefore power is lacking for detecting SNP‐phenotype associations. These SNPs are also more prone to genotyping errors. The MAF threshold should depend on your sample size, larger samples can use lower MAF thresholds. Respectively, for large (N = 100.000) vs. moderate samples (N = 10000), 0.01 and 0.05 are commonly used as MAF threshold. |
| 4: Hardy–Weinberg equilibrium (HWE) | ‐‐hwe | Excludes markers which deviate from Hardy–Weinberg equilibrium. | Common indicator of genotyping error, may also indicate evolutionary selection.For binary traits we suggest to exclude: HWE p value <1e−10 in cases and <1e−6 in controls. Less strict case threshold avoids discarding disease‐associated SNPs under selection (see online tutorial at https://github.com/MareesAT/GWA_tutorial/).For quantitative traits, we recommend HWE p value <1e‐6. |
| 5: Heterozygosity | For an example script see https://github.com/MareesAT/GWA_tutorial/ | Excludes individuals with high or low heterozygosity rates | Deviations can indicate sample contamination, inbreeding.We suggest removing individuals who deviate ±3 SD from the samples' heterozygosity rate mean. |
| 6: Relatedness | ‐‐genome | Calculates identity by descent (IBD) of all sample pairs. | Use independent SNPs (pruning) for this analysis and limit it to autosomal chromosomes only. |
| ‐‐min | Sets threshold and creates a list of individuals with relatedness above the chosen threshold. Meaning that subjects who are related at, for example, pi‐hat >0.2 (i.e., second degree relatives) can be detected. | Cryptic relatedness can interfere with the association analysis. If you have a family‐based sample (e.g., parent‐offspring), you do not need to remove related pairs but the statistical analysis should take family relatedness into account. However, for a population based sample we suggest to use a pi‐hat threshold of 0.2, which in line with the literature (Anderson et al., 2010; Guo et al., 2014). | |
| 7: Population stratification | ‐‐genome | Calculates identity by descent (IBD) of all sample pairs. | Use independent SNPs (pruning) for this analysis and limit it to autosomal chromosomes only. |
| ‐‐cluster ‐‐mds‐plot k | Produces a k‐dimensional representation of any substructure in the data, based on IBS. | K is the number of dimensions, which needs to be defined (typically 10). This is an important step of the QC that consists of multiple proceedings but for reasons of completeness we briefly refer to this step in the table. This step will be described in more detail in section “controlling for population stratification.” |
4. 人口分层
-
多维缩放(MDS)方法。该方法计算样品中任何一对个体之间共有的等位基因的全基因组平均比例,以产生每个个体的遗传变异的定量指标(组分)。
 image.png
5. 关联分析
- case and control
- 在PLINK中,SNP与二元结果之间的关联(值1 =未受影响,值2 =受影响; 0和-9表示缺失;前面表示PLINK中的默认选项并且可以更改)可以使用选项进行测试 - assoc或 - logistic。assocPLINK中的 - 选项执行X 2关联测试,不允许包含协变量。使用 - logistic选项,将执行逻辑回归分析,允许包含协变量。- logistic选项比- 选项更灵活assoc,但它的代价是增加了计算时间。
- 定量结果测量
- 在PLINK中,SNP和定量结果测量之间的关联可以用选项 - assoc和 - 进行测试linear。当PLINK检测到定量结果测量值(即,除1,2或0以外的值)时, - assoc选项将通过执行通常Student's t检验的渐近版本来自动处理它,以比较两种方法。此选项不允许使用协变量。linearPLINK中的 - 选项执行线性回归分析,每个SNP作为预测因子。与 - logistic选项类似, - linear选项允许使用协变量,并且比 - assoc选项稍慢。
- 多次检验校正
- Bonferroni校正旨在控制具有至少一个假阳性发现的概率,用公式0.05 / n计算调整的p值阈值,其中n是测试的SNP的数量。然而,如前所述,由于连锁不平衡(LD),许多SNP是相关的,因此根据定义不是独立的。因此,这种方法通常过于保守,导致假阴性结果的比例增加。
- FDR是一种最小化假阳性预期比例的方法,例如,用于后续分析。此外,该方法作为SNP具有其自身的局限性,因此p值不是独立的
- PLINK提供了选项 - adjust生成未调整的输出显示p值,以及用各种多种测试校正方法校正的p值。
6. 多基因测试
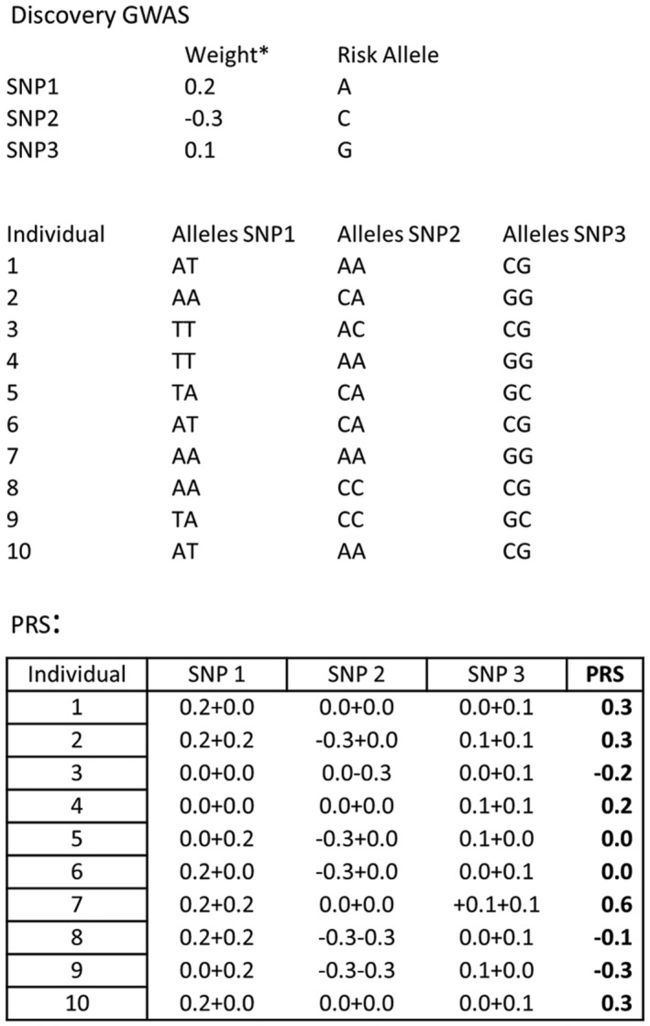
image.png
- 多基因风险预测分析
教程
- 选用207个北欧和西欧(CEU)的犹他州居民
1. QC
1.1 查看缺失率
### Step 1 ###

# Investigate missingness per individual and per SNP and make histograms.
plink --bfile HapMap_3_r3_1 --missing
# output: plink.imiss and plink.lmiss, these files show respectively the proportion of missing SNPs per individual and the proportion of missing individuals per SNP.

# Generate plots to visualize the missingness results.
Rscript --no-save hist_miss.R
- hist_miss.R
indmiss<-read.table(file="plink.imiss", header=TRUE)
snpmiss<-read.table(file="plink.lmiss", header=TRUE)
# read data into R

pdf("histimiss.pdf") #indicates pdf format and gives title to file
hist(indmiss[,6],main="Histogram individual missingness") #selects column 6, names header of file

pdf("histlmiss.pdf")
hist(snpmiss[,5],main="Histogram SNP missingness")
dev.off() # shuts down the current device
- 删除snp --geno,删除个体 --mind
# Delete SNPs and individuals with high levels of missingness, explanation of this and all following steps can be found in box 1 and table 1 of the article mentioned in the comments of this script.
# The following two QC commands will not remove any SNPs or individuals. However, it is good practice to start the QC with these non-stringent thresholds.
# Delete SNPs with missingness >0.2.
plink --bfile HapMap_3_r3_1 --geno 0.2 --make-bed --out HapMap_3_r3_2

# Delete individuals with missingness >0.2.
plink --bfile HapMap_3_r3_2 --mind 0.2 --make-bed --out HapMap_3_r3_3

# Delete SNPs with missingness >0.02.
plink --bfile HapMap_3_r3_3 --geno 0.02 --make-bed --out HapMap_3_r3_4

# Delete individuals with missingness >0.02.
plink --bfile HapMap_3_r3_4 --mind 0.02 --make-bed --out HapMap_3_r3_5
1.2 查看性别
###################################################################
### Step2 ####

# Check for sex discrepancy.
# Subjects who were a priori determined as females must have a F value of <0.2, and subjects who were a priori determined as males must have a F value >0.8. This F value is based on the X chromosome inbreeding (homozygosity) estimate.
# Subjects who do not fulfil these requirements are flagged "PROBLEM" by PLINK.

plink --bfile HapMap_3_r3_5 --check-sex

# Generate plots to visualize the sex-check results.
Rscript --no-save gender_check.R
- gender_check.R
gender <- read.table("plink.sexcheck", header=T,as.is=T)

pdf("Gender_check.pdf")
hist(gender[,6],main="Gender", xlab="F")
dev.off()

pdf("Men_check.pdf")
male=subset(gender, gender$PEDSEX==1)
hist(male[,6],main="Men",xlab="F")
dev.off()

pdf("Women_check.pdf")
female=subset(gender, gender$PEDSEX==2)
hist(female[,6],main="Women",xlab="F")
dev.off()
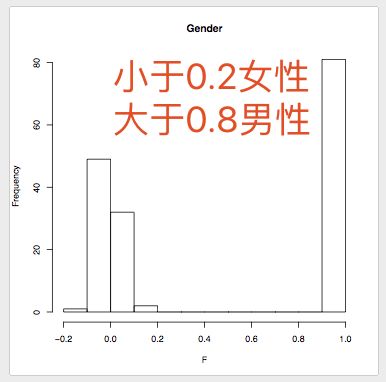
image.png
# These checks indicate that there is one woman with a sex discrepancy, F value of 0.99. (When using other datasets often a few discrepancies will be found).

# The following two scripts can be used to deal with individuals with a sex discrepancy.
# Note, please use one of the two options below to generate the bfile hapmap_r23a_6, this file we will use in the next step of this tutorial.

# 1) Delete individuals with sex discrepancy.
grep "PROBLEM" plink.sexcheck| awk '{print$1,$2}'> sex_discrepancy.txt
# This command generates a list of individuals with the status “PROBLEM”.
plink --bfile HapMap_3_r3_5 --remove sex_discrepancy.txt --make-bed --out HapMap_3_r3_6
# This command removes the list of individuals with the status “PROBLEM”.

# 2) impute-sex.
#plink --bfile HapMap_3_r3_5 --impute-sex --make-bed --out HapMap_3_r3_6
# This imputes the sex based on the genotype information into your data set.

####1.3 MAF
###################################################
### Step 3 ###

# Generate a bfile with autosomal SNPs only and delete SNPs with a low minor allele frequency (MAF).

# Select autosomal SNPs only (i.e., from chromosomes 1 to 22).
awk '{ if ($1 >= 1 && $1 <= 22) print $2 }' HapMap_3_r3_6.bim > snp_1_22.txt
plink --bfile HapMap_3_r3_6 --extract snp_1_22.txt --make-bed --out HapMap_3_r3_7

# Generate a plot of the MAF distribution.
plink --bfile HapMap_3_r3_7 --freq --out MAF_check
Rscript --no-save MAF_check.R
- MAF_check.R
maf_freq <- read.table("MAF_check.frq", header =TRUE, as.is=T)
pdf("MAF_distribution.pdf")
hist(maf_freq[,5],main = "MAF distribution", xlab = "MAF")
dev.off()
# Remove SNPs with a low MAF frequency.
plink --bfile HapMap_3_r3_7 --maf 0.05 --make-bed --out HapMap_3_r3_8
# 1073226 SNPs are left
# A conventional MAF threshold for a regular GWAS is between 0.01 or 0.05, depending on sample size.
1.4 Hardy-Weinberg equilibrium (HWE).
####################################################
### Step 4 ###

# Delete SNPs which are not in Hardy-Weinberg equilibrium (HWE).
# Check the distribution of HWE p-values of all SNPs.

plink --bfile HapMap_3_r3_8 --hardy
# Selecting SNPs with HWE p-value below 0.00001, required for one of the two plot generated by the next Rscript, allows to zoom in on strongly deviating SNPs.
awk '{ if ($9 <0.00001) print $0 }' plink.hwe>plinkzoomhwe.hwe
Rscript --no-save hwe.R
- Rscript --no-save hwe.R
hwe<-read.table (file="plink.hwe", header=TRUE)
pdf("histhwe.pdf")
hist(hwe[,9],main="Histogram HWE")
dev.off()

hwe_zoom<-read.table (file="plinkzoomhwe.hwe", header=TRUE)
pdf("histhwe_below_theshold.pdf")
hist(hwe_zoom[,9],main="Histogram HWE: strongly deviating SNPs only")
dev.off()
# By default the --hwe option in plink only filters for controls.
# Therefore, we use two steps, first we use a stringent HWE threshold for controls, followed by a less stringent threshold for the case data.
plink --bfile HapMap_3_r3_8 --hwe 1e-6 --make-bed --out HapMap_hwe_filter_step1

# The HWE threshold for the cases filters out only SNPs which deviate extremely from HWE.
# This second HWE step only focusses on cases because in the controls all SNPs with a HWE p-value < hwe 1e-6 were already removed
plink --bfile HapMap_hwe_filter_step1 --hwe 1e-10 --hwe-all --make-bed --out HapMap_3_r3_9

# Theoretical background for this step is given in our accompanying article: https://www.ncbi.nlm.nih.gov/pubmed/29484742 .
1.5 heterozygosity rate 杂合率
- 杂合率,给定个体的杂合基因型的比例。
- 偏差可能表明样品污染,近亲繁殖。我们建议去除偏离样本的杂合率平均值±3 SD的个体。
############################################################
### step 5 ###

# Generate a plot of the distribution of the heterozygosity rate of your subjects.
# And remove individuals with a heterozygosity rate deviating more than 3 sd from the mean.

# Checks for heterozygosity are performed on a set of SNPs which are not highly correlated.
# Therefore, to generate a list of non-(highly)correlated SNPs, we exclude high inversion regions (inversion.txt [High LD regions]) and prune the SNPs using the command --indep-pairwise’.
# The parameters ‘50 5 0.2’ stand respectively for: the window size, the number of SNPs to shift the window at each step, and the multiple correlation coefficient for a SNP being regressed on all other SNPs simultaneously.

plink --bfile HapMap_3_r3_9 --exclude inversion.txt --range --indep-pairwise 50 5 0.2 --out indepSNP
# Note, don't delete the file indepSNP.prune.in, we will use this file in later steps of the tutorial.

plink --bfile HapMap_3_r3_9 --extract indepSNP.prune.in --het --out R_check
# This file contains your pruned data set.

# Plot of the heterozygosity rate distribution
Rscript --no-save check_heterozygosity_rate.R
- check_heterozygosity_rate.R
het <- read.table("R_check.het", head=TRUE)
pdf("heterozygosity.pdf")
het$HET_RATE = (het$"N.NM." - het$"O.HOM.")/het$"N.NM."
hist(het$HET_RATE, xlab="Heterozygosity Rate", ylab="Frequency", main= "Heterozygosity Rate")
dev.off()
# The following code generates a list of individuals who deviate more than 3 standard deviations from the heterozygosity rate mean.
# For data manipulation we recommend using UNIX. However, when performing statistical calculations R might be more convenient, hence the use of the Rscript for this step:
Rscript --no-save heterozygosity_outliers_list.R
- heterozygosity_outliers_list.R
het <- read.table("R_check.het", head=TRUE)
het$HET_RATE = (het$"N.NM." - het$"O.HOM.")/het$"N.NM."
het_fail = subset(het, (het$HET_RATE < mean(het$HET_RATE)-3*sd(het$HET_RATE)) | (het$HET_RATE > mean(het$HET_RATE)+3*sd(het$HET_RATE)));
het_fail$HET_DST = (het_fail$HET_RATE-mean(het$HET_RATE))/sd(het$HET_RATE);
write.table(het_fail, "fail-het-qc.txt", row.names=FALSE)
# Output of the command above: fail-het-qc.txt .
# When using our example data/the HapMap data this list contains 2 individuals (i.e., two individuals have a heterozygosity rate deviating more than 3 SD's from the mean).
# Adapt this file to make it compatible for PLINK, by removing all quotation marks from the file and selecting only the first two columns.
sed 's/"// g' fail-het-qc.txt | awk '{print$1, $2}'> het_fail_ind.txt

# Remove heterozygosity rate outliers.
plink --bfile HapMap_3_r3_9 --remove het_fail_ind.txt --make-bed --out HapMap_3_r3_10
1.6 删除亲本
############################################################
### step 6 ###

# It is essential to check datasets you analyse for cryptic relatedness.
# Assuming a random population sample we are going to exclude all individuals above the pihat threshold of 0.2 in this tutorial.

# Check for relationships between individuals with a pihat > 0.2.
plink --bfile HapMap_3_r3_10 --extract indepSNP.prune.in --genome --min 0.2 --out pihat_min0.2

# The HapMap dataset is known to contain parent-offspring relations.
# The following commands will visualize specifically these parent-offspring relations, using the z values.
awk '{ if ($8 >0.9) print $0 }' pihat_min0.2.genome>zoom_pihat.genome

# Generate a plot to assess the type of relationship.
Rscript --no-save Relatedness.R
- Relatedness.R
pdf("relatedness.pdf")
relatedness = read.table("pihat_min0.2.genome", header=T)
par(pch=16, cex=1)
with(relatedness,plot(Z0,Z1, xlim=c(0,1), ylim=c(0,1), type="n"))
with(subset(relatedness,RT=="PO") , points(Z0,Z1,col=4))
with(subset(relatedness,RT=="UN") , points(Z0,Z1,col=3))
legend(1,1, xjust=1, yjust=1, legend=levels(relatedness$RT), pch=16, col=c(4,3))

pdf("zoom_relatedness.pdf")
relatedness_zoom = read.table("zoom_pihat.genome", header=T)
par(pch=16, cex=1)
with(relatedness_zoom,plot(Z0,Z1, xlim=c(0,0.02), ylim=c(0.98,1), type="n"))
with(subset(relatedness_zoom,RT=="PO") , points(Z0,Z1,col=4))
with(subset(relatedness_zoom,RT=="UN") , points(Z0,Z1,col=3))
legend(0.02,1, xjust=1, yjust=1, legend=levels(relatedness$RT), pch=16, col=c(4,3))

pdf("hist_relatedness.pdf")
relatedness = read.table("pihat_min0.2.genome", header=T)
hist(relatedness[,10],main="Histogram relatedness", xlab= "Pihat")
dev.off()
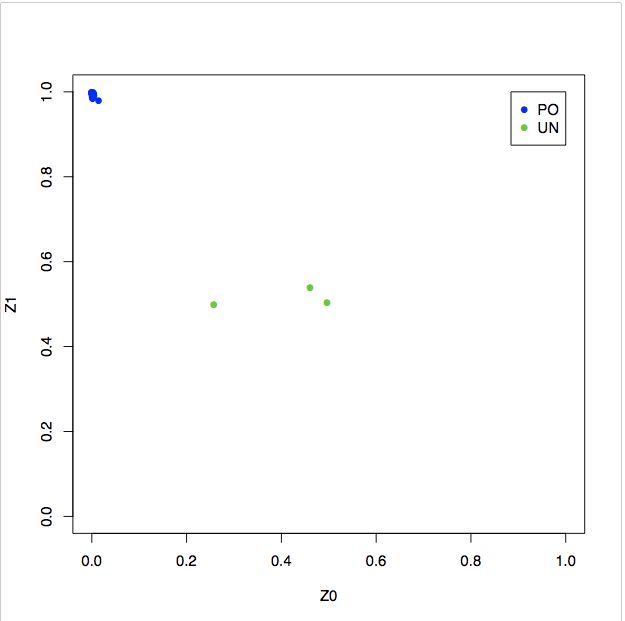
image.png

image.png
# The generated plots show a considerable amount of related individuals (explentation plot; PO = parent-offspring, UN = unrelated individuals) in the Hapmap data, this is expected since the dataset was constructed as such.
# Normally, family based data should be analyzed using specific family based methods. In this tutorial, for demonstrative purposes, we treat the relatedness as cryptic relatedness in a random population sample.
# In this tutorial, we aim to remove all 'relatedness' from our dataset.
# To demonstrate that the majority of the relatedness was due to parent-offspring we only include founders (individuals without parents in the dataset).

plink --bfile HapMap_3_r3_10 --filter-founders --make-bed --out HapMap_3_r3_11

# Now we will look again for individuals with a pihat >0.2.
plink --bfile HapMap_3_r3_11 --extract indepSNP.prune.in --genome --min 0.2 --out pihat_min0.2_in_founders
# The file 'pihat_min0.2_in_founders.genome' shows that, after exclusion of all non-founders, only 1 individual pair with a pihat greater than 0.2 remains in the HapMap data.
# This is likely to be a full sib or DZ twin pair based on the Z values. Noteworthy, they were not given the same family identity (FID) in the HapMap data.

# For each pair of 'related' individuals with a pihat > 0.2, we recommend to remove the individual with the lowest call rate.
plink --bfile HapMap_3_r3_11 --missing
# Use an UNIX text editor (e.g., vi(m) ) to check which individual has the highest call rate in the 'related pair'.

# Generate a list of FID and IID of the individual(s) with a Pihat above 0.2, to check who had the lower call rate of the pair.
# In our dataset the individual 13291  NA07045 had the lower call rate.
vi 0.2_low_call_rate_pihat.txt
i
13291  NA07045
# Press esc on keyboard!
:x
# Press enter on keyboard
# In case of multiple 'related' pairs, the list generated above can be extended using the same method as for our lone 'related' pair.

# Delete the individuals with the lowest call rate in 'related' pairs with a pihat > 0.2
plink --bfile HapMap_3_r3_11 --remove 0.2_low_call_rate_pihat.txt --make-bed --out HapMap_3_r3_12

################################################################################################################################

# CONGRATULATIONS!! You've just succesfully completed the first tutorial! You are now able to conduct a proper genetic QC.

# For the next tutorial, using the script: 2_Main_script_MDS.txt, you need the following files:
# - The bfile HapMap_3_r3_12 (i.e., HapMap_3_r3_12.fam,HapMap_3_r3_12.bed, and HapMap_3_r3_12.bim
# - indepSNP.prune.in
2. 人群分层
- 多维缩放(MDS)方法。该方法计算样品中任何一对个体之间共有的等位基因的全基因组平均比例,以产生每个个体的遗传变异的定量指标(组分)。可以绘制单个组分分数以探究是否存在遗传上彼此比预期更相似的个体组。例如,在包括来自亚洲和欧洲的受试者的遗传研究中,MDS分析将揭示亚洲人在基因上彼此更相似而不是欧洲人。
2.1 下载千人基因组数据60G
- 629 个人的全基因组数据60G
## Download 1000 Genomes data ##
# This file from the 1000 Genomes contains genetic data of 629 individuals from different ethnic backgrounds.
# Note, this file is quite large (>60 gigabyte).
wget ftp://ftptrace.ncbi.nih.gov/1000genomes/ftp/release/20100804/ALL.2of4intersection.20100804.genotypes.vcf.gz

# Convert vcf to Plink format.
plink --vcf ALL.2of4intersection.20100804.genotypes.vcf.gz --make-bed --out ALL.2of4intersection.20100804.genotypes

# Noteworthy, the file 'ALL.2of4intersection.20100804.genotypes.bim' contains SNPs without an rs-identifier, these SNPs are indicated with ".". This can also be observed in the file 'ALL.2of4intersection.20100804.genotypes.vcf.gz'. To check this file use this command: zmore ALL.2of4intersection.20100804.genotypes.vcf.gz .

# The missing rs-identifiers in the 1000 Genomes data are not a problem for this tutorial.
# However, for good practice, we will assign unique indentifiers to the SNPs with a missing rs-identifier (i.e., the SNPs with ".").

###补充rs ID

plink --bfile ALL.2of4intersection.20100804.genotypes --set-missing-var-ids @:#[b37]\$1,\$2 --make-bed --out ALL.2of4intersection.20100804.genotypes_no_missing_IDs


## QC on 1000 Genomes data.
# Remove variants based on missing genotype data.
plink --bfile ALL.2of4intersection.20100804.genotypes_no_missing_IDs --geno 0.2 --allow-no-sex --make-bed --out 1kG_MDS


# Remove individuals based on missing genotype data.
plink --bfile 1kG_MDS --mind 0.2 --allow-no-sex --make-bed --out 1kG_MDS2


# Remove variants based on missing genotype data.
plink --bfile 1kG_MDS2 --geno 0.02 --allow-no-sex --make-bed --out 1kG_MDS3


# Remove individuals based on missing genotype data.
plink --bfile 1kG_MDS3 --mind 0.02 --allow-no-sex --make-bed --out 1kG_MDS4


# Remove variants based on MAF.
plink --bfile 1kG_MDS4 --maf 0.05 --allow-no-sex --make-bed --out 1kG_MDS5
- 取相同的variants
# 从千人基因组中提取相同的variants
# Extract the variants present in HapMap dataset from the 1000 genomes dataset.
awk '{print$2}' HapMap_3_r3_12.bim > HapMap_SNPs.txt
plink --bfile 1kG_MDS5 --extract HapMap_SNPs.txt --make-bed --out 1kG_MDS6


# 反向提取一遍,把没匹配上的删除
# Extract the variants present in 1000 Genomes dataset from the HapMap dataset.
awk '{print$2}' 1kG_MDS6.bim > 1kG_MDS6_SNPs.txt
plink --bfile HapMap_3_r3_12 --extract 1kG_MDS6_SNPs.txt --recode --make-bed --out HapMap_MDS
# The datasets now contain the exact same variants.


## The datasets must have the same build. Change the build 1000 Genomes data build.
awk '{print$2,$4}' HapMap_MDS.map > buildhapmap.txt
# buildhapmap.txt contains one SNP-id and physical position per line.

plink --bfile 1kG_MDS6 --update-map buildhapmap.txt --make-bed --out 1kG_MDS7
# 1kG_MDS7 and HapMap_MDS now have the same build.
- 合并两个文件
## Merge the HapMap and 1000 Genomes data sets

# Prior to merging 1000 Genomes data with the HapMap data we want to make sure that the files are mergeable, for this we conduct 3 steps:
# 1) Make sure the reference genome is similar in the HapMap and the 1000 Genomes Project datasets.
# 2) Resolve strand issues.
# 3) Remove the SNPs which after the previous two steps still differ between datasets.

# The following steps are maybe quite technical in terms of commands, but we just compare the two data sets and make sure they correspond.

# 1) set reference genome
awk '{print$2,$5}' 1kG_MDS7.bim > 1kg_ref-list.txt
plink --bfile HapMap_MDS --reference-allele 1kg_ref-list.txt --make-bed --out HapMap-adj
# The 1kG_MDS7 and the HapMap-adj have the same reference genome for all SNPs.
# This command will generate some warnings for impossible A1 allele assignment.

# 2) Resolve strand issues.
# Check for potential strand issues.
awk '{print$2,$5,$6}' 1kG_MDS7.bim > 1kGMDS7_tmp
awk '{print$2,$5,$6}' HapMap-adj.bim > HapMap-adj_tmp
sort 1kGMDS7_tmp HapMap-adj_tmp |uniq -u > all_differences.txt
# 1624 differences between the files, some of these might be due to strand issues. 正反链的问题

## Flip SNPs for resolving strand issues.
# Print SNP-identifier and remove duplicates.
# 这里-u 是unique 的意思
awk '{print$1}' all_differences.txt | sort -u > flip_list.txt
# Generates a file of 812 SNPs. These are the non-corresponding SNPs between the two files.
# Flip the 812 non-corresponding SNPs.

#flip for example, a A/C SNP will become a T/G; alternatively, a A/T SNP will become a T/A SNP
plink --bfile HapMap-adj --flip flip_list.txt --reference-allele 1kg_ref-list.txt --make-bed --out corrected_hapmap

# Check for SNPs which are still problematic after they have been flipped.
awk '{print$2,$5,$6}' corrected_hapmap.bim > corrected_hapmap_tmp
sort 1kGMDS7_tmp corrected_hapmap_tmp |uniq -u  > uncorresponding_SNPs.txt
# This file demonstrates that there are 84 differences between the files.

# 3) Remove problematic SNPs from HapMap and 1000 Genomes.
awk '{print$1}' uncorresponding_SNPs.txt | sort -u > SNPs_for_exlusion.txt
# The command above generates a list of the 42 SNPs which caused the 84 differences between the HapMap and the 1000 Genomes data sets after flipping and setting of the reference genome.

# Remove the 42 problematic SNPs from both datasets.
plink --bfile corrected_hapmap --exclude SNPs_for_exlusion.txt --make-bed --out HapMap_MDS2
plink --bfile 1kG_MDS7 --exclude SNPs_for_exlusion.txt --make-bed --out 1kG_MDS8

# Merge HapMap with 1000 Genomes Data.
plink --bfile HapMap_MDS2 --bmerge 1kG_MDS8.bed 1kG_MDS8.bim 1kG_MDS8.fam --allow-no-sex --make-bed --out MDS_merge2
# Note, we are fully aware of the sample overlap between the HapMap and 1000 Genomes datasets. However, for the purpose of this tutorial this is not important.

## Perform MDS on HapMap-CEU data anchored by 1000 Genomes data.
# Using a set of pruned SNPs
plink --bfile MDS_merge2 --extract indepSNP.prune.in --genome --out MDS_merge2
plink --bfile MDS_merge2 --read-genome MDS_merge2.genome --cluster --mds-plot 10 --out MDS_merge2
### MDS-plot

# Download the file with population information of the 1000 genomes dataset.
wget ftp://ftp.1000genomes.ebi.ac.uk/vol1/ftp/release/20100804/20100804.ALL.panel
# The file 20100804.ALL.panel contains population codes of the individuals of 1000 genomes.

# Convert population codes into superpopulation codes (i.e., AFR,AMR,ASN, and EUR).
awk '{print$1,$1,$2}' 20100804.ALL.panel > race_1kG.txt
sed 's/JPT/ASN/g' race_1kG.txt>race_1kG2.txt
sed 's/ASW/AFR/g' race_1kG2.txt>race_1kG3.txt
sed 's/CEU/EUR/g' race_1kG3.txt>race_1kG4.txt
sed 's/CHB/ASN/g' race_1kG4.txt>race_1kG5.txt
sed 's/CHD/ASN/g' race_1kG5.txt>race_1kG6.txt
sed 's/YRI/AFR/g' race_1kG6.txt>race_1kG7.txt
sed 's/LWK/AFR/g' race_1kG7.txt>race_1kG8.txt
sed 's/TSI/EUR/g' race_1kG8.txt>race_1kG9.txt
sed 's/MXL/AMR/g' race_1kG9.txt>race_1kG10.txt
sed 's/GBR/EUR/g' race_1kG10.txt>race_1kG11.txt
sed 's/FIN/EUR/g' race_1kG11.txt>race_1kG12.txt
sed 's/CHS/ASN/g' race_1kG12.txt>race_1kG13.txt
sed 's/PUR/AMR/g' race_1kG13.txt>race_1kG14.txt

# Create a racefile of your own data.
awk '{print$1,$2,"OWN"}' HapMap_MDS.fam>racefile_own.txt

# Concatenate racefiles.
# sed 在mac 下1i\ 后面需要换行
cat race_1kG14.txt racefile_own.txt | sed -e '1i\
FID IID race' > racefile.txt

# Generate population stratification plot.
Rscript MDS_merged.R
# The output file MDS.pdf demonstrates that our ‘own’ data falls within the European group of the 1000 genomes data. Therefore, we do not have to remove subjects.
# For educational purposes however, we give scripts below to filter out population stratification outliers. Please execute the script below in order to generate the appropriate files for the next tutorial.
- MDS_merged.R
data<- read.table(file="MDS_merge2.mds",header=TRUE)
race<- read.table(file="racefile.txt",header=TRUE)
datafile<- merge(data,race,by=c("IID","FID"))
head(datafile)

pdf("MDS.pdf",width=7,height=7)
for (i in 1:nrow(datafile))
{
if (datafile[i,14]=="EUR") {plot(datafile[i,4],datafile[i,5],type="p",xlim=c(-0.1,0.2),ylim=c(-0.15,0.1),xlab="MDS Component 1",ylab="MDS Component 2",pch=1,cex=0.5,col="green")}
par(new=T)
if (datafile[i,14]=="ASN") {plot(datafile[i,4],datafile[i,5],type="p",xlim=c(-0.1,0.2),ylim=c(-0.15,0.1),xlab="MDS Component 1",ylab="MDS Component 2",pch=1,cex=0.5,col="red")}
par(new=T)
if (datafile[i,14]=="AMR") {plot(datafile[i,4],datafile[i,5],type="p",xlim=c(-0.1,0.2),ylim=c(-0.15,0.1),xlab="MDS Component 1",ylab="MDS Component 2",pch=1,cex=0.5,col=470)}
par(new=T)
if (datafile[i,14]=="AFR") {plot(datafile[i,4],datafile[i,5],type="p",xlim=c(-0.1,0.2),ylim=c(-0.15,0.1),xlab="MDS Component 1",ylab="MDS Component 2",pch=1,cex=0.5,col="blue")}
par(new=T)
if (datafile[i,14]=="OWN") {plot(datafile[i,4],datafile[i,5],type="p",xlim=c(-0.1,0.2),ylim=c(-0.15,0.1),xlab="MDS Component 1",ylab="MDS Component 2",pch=3,cex=0.7,col="black")}
par(new=T)
}

abline(v=-0.035,lty=3)
abline(h=0.035,lty=3)
legend("topright", pch=c(1,1,1,1,3),c("EUR","ASN","AMR","AFR","OWN"),col=c("green","red",470,"blue","black"),bty="o",cex=1)
image.png
## Exclude ethnic outliers.
# Select individuals in HapMap data below cut-off thresholds. The cut-off levels are not fixed thresholds but have to be determined based on the visualization of the first two dimensions. To exclude ethnic outliers, the thresholds need to be set around the cluster of population of interest.
awk '{ if ($4 <-0.04 && $5 >0.03) print $1,$2 }' MDS_merge2.mds > EUR_MDS_merge2

# Extract these individuals in HapMap data.
plink --bfile HapMap_3_r3_12 --keep EUR_MDS_merge2 --make-bed --out HapMap_3_r3_13
# Note, since our HapMap data did include any ethnic outliers, no individuls were removed at this step. However, if our data would have included individuals outside of the thresholds we set, then these individuals would have been removed.

## Create covariates based on MDS.
# Perform an MDS ONLY on HapMap data without ethnic outliers. The values of the 10 MDS dimensions are subsequently used as covariates in the association analysis in the third tutorial.
plink --bfile HapMap_3_r3_13 --extract indepSNP.prune.in --genome --out HapMap_3_r3_13
plink --bfile HapMap_3_r3_13 --read-genome HapMap_3_r3_13.genome --cluster --mds-plot 10 --out HapMap_3_r3_13_mds

# Change the format of the .mds file into a plink covariate file.
awk '{print$1, $2, $4, $5, $6, $7, $8, $9, $10, $11, $12, $13}' HapMap_3_r3_13_mds.mds > covar_mds.txt

# The values in covar_mds.txt will be used as covariates, to adjust for remaining population stratification, in the third tutorial where we will perform a genome-wide association analysis.

##########################################################################################################################################################################

## CONGRATULATIONS you have succesfully controlled your data for population stratification!

# For the next tutorial you need the following files:
# - HapMap_3_r3_13 (the bfile, i.e., HapMap_3_r3_13.bed,HapMap_3_r3_13.bim,and HapMap_3_r3_13.fam
# - covar_mds.txt
3. 关联分析
################ Explanation of the main script ##########################

# Just as with the previous tutorials, this tutorial can be completed simply by copy-and-pasting all commands from this ‘main script’ into the Unix terminal.
# For a theoretical background on these method we refer to the accompanying article entitled “A tutorial on conducting Genome-Wide-Association Studies: Quality control and statistical analysis” (https://www.ncbi.nlm.nih.gov/pubmed/29484742).
# In order to run this script you need the following files from the previous tutorial: covar_mds.txt and HapMap_3_r3_13 (bfile, i.e., HapMap_3_r3_13.bed, HapMap_3_r3_13.bim, HapMap_3_r3_13.fam).

###########################################################
### Association analyses ###

# For the association analyses we use the files generated in the previous tutorial (population stratification), named: HapMap_3_r3_13 (with .bed, .bim, and .fam. extensions) and covar_mds.txt

# Copy the bfile HapMap_3_r3_13 from the previous tutorial to the current directory.
cp HOME/{user}/{path/ 2_Population_stratification}/HapMap_3_r3_13.* HOME/{user}/{path/3_Main_script_association_GWAS.txt}
# Copy the covar_mds.txt from the previous tutorial in the current directory.
cp HOME/{user}/{path/ 2_Population_stratification}/covar_mds.txt HOME/{user}/{path/3_Main_script_association_GWAS.txt}
- assoc
# For binary traits.

# assoc
# 关联分析没有协变量
plink --bfile HapMap_3_r3_13 --assoc --out assoc_results
# Note, the --assoc option does not allow to correct covariates such as principal components (PC's)/ MDS components, which makes it less suited for association analyses.
- logistic
# logistic
# We will be using 10 principal components as covariates in this logistic analysis. We use the MDS components calculated from the previous tutorial: covar_mds.txt.
plink --bfile HapMap_3_r3_13 --covar covar_mds.txt --logistic --hide-covar --out logistic_results
# Note, we use the option -–hide-covar to only show the additive results of the SNPs in the output file.

# Remove NA values, those might give problems generating plots in later steps.
awk '!/'NA'/' logistic_results.assoc.logistic > logistic_results.assoc_2.logistic

# The results obtained from these GWAS analyses will be visualized in the last step. This will also show if the data set contains any genome-wide significant SNPs.

# Note, in case of a quantitative outcome measure the option --logistic should be replaced by --linear. The use of the --assoc option is also possible for quantitative outcome measures (as metioned previously, this option does not allow the use of covariates).
- Multiple testing
#################################################################

# Multiple testing
# There are various way to deal with multiple testing outside of the conventional genome-wide significance threshold of 5.0E-8, below we present a couple.

#adjust
plink --bfile HapMap_3_r3_13 -assoc --adjust --out adjusted_assoc_results
# This file gives a Bonferroni corrected p-value, along with FDR and others.


## Permutation 置换
# This is a computational intensive step. Further pros and cons of this method, which can be used for association and dealing with multiple testing, are described in our article corresponding to this tutorial (https://www.ncbi.nlm.nih.gov/pubmed/29484742).
# The reduce computational time we only perform this test on a subset of the SNPs from chromosome 22.
# The EMP2 collumn provides the for multiple testing corrected p-value.

# Generate subset of SNPs
awk '{ if ($4 >= 21595000 && $4 <= 21605000) print $2 }' HapMap_3_r3_13.bim > subset_snp_chr_22.txt
# Filter your bfile based on the subset of SNPs generated in the step above.
plink --bfile HapMap_3_r3_13 --extract subset_snp_chr_22.txt --make-bed --out HapMap_subset_for_perm
# Perform 1000000 perrmutations.
plink --bfile HapMap_subset_for_perm --assoc --mperm 1000000 --out subset_1M_perm_result

# Order your data, from lowest to highest p-value.
sort -gk 4 subset_1M_perm_result.assoc.mperm > sorted_subset.txt
# Check ordered permutation results
head sorted_subset.txt
- 画图
# Generate Manhattan and QQ plots.

# These scripts assume R >= 3.0.0.
# If you changed the name of the .assoc file or to the assoc.logistic file, please assign those names also to the Rscripts for the Manhattan and QQ plot, otherwise the scripts will not run.

# The following Rscripts require the R package qqman, the scripts provided will automatically download this R package and install it in /home/{user}/ . Additionally, the scripts load the qqman library and can therefore, similar to all other Rscript on this GitHub page, be executed from the command line.
# This location can be changed to your desired directory

Rscript --no-save Manhattan_plot.R
Rscript --no-save QQ_plot.R

# Please read below when you encountered an error:
# Note, the mirror used to download the package qqman can no longer by active, which will result in an error (so below for specific error).
# If you encounter this error, please contact me at [email protected].
# This error can simply be resolved by changing the addresses in the scripts: Manhattan_plot.R and QQ_plot.R.
# Simply change the address (http://cran...) in line below, in both Rscripts (Manhattan_plot.R and QQ_plot.R) with (for example) https://cran.univ-paris1.fr/ .
# install.packages("qqman",repos="http://cran.cnr.berkeley.edu/",lib="~" ) # location of installation can be changed but has to correspond with the library location

# Example error:
# "Error in library("qqman", lib.loc = "-") :
#   there is no package called 'qqman'
#Execution halted"

#######################################################

## CONGRATULATIONS you have succesfully conducted a GWAS analyses!!

# If you are also interested in learning how to conduct a polygenic risk score (PRS) analysis please see our fourth tutorial.
# The tutorial explaining PRS is independent from the previous tutorials.
- Manhattan_plot.R
#install.packages("qqman",repos="http://cran.cnr.berkeley.edu/",lib="~" ) # location of installation can be changed but has to correspond with the library location
library("qqman",lib.loc="~")
results_log <- read.table("logistic_results.assoc_2.logistic", head=TRUE)
jpeg("Logistic_manhattan.jpeg")
manhattan(results_log,chr="CHR",bp="BP",p="P",snp="SNP", main = "Manhattan plot: logistic")
dev.off()

results_as <- read.table("assoc_results.assoc", head=TRUE)
jpeg("assoc_manhattan.jpeg")
manhattan(results_as,chr="CHR",bp="BP",p="P",snp="SNP", main = "Manhattan plot: assoc")
dev.off()

image.png
- QQ_plot.R
#install.packages("qqman",repos="http://cran.cnr.berkeley.edu/",lib="~" ) # location of installation can be changed but has to correspond with the library location
library("qqman",lib.loc="~")
results_log <- read.table("logistic_results.assoc_2.logistic", head=TRUE)
jpeg("QQ-Plot_logistic.jpeg")
qq(results_log$P, main = "Q-Q plot of GWAS p-values : log")
dev.off()

results_as <- read.table("assoc_results.assoc", head=TRUE)
jpeg("QQ-Plot_assoc.jpeg")
qq(results_as$P, main = "Q-Q plot of GWAS p-values : log")
dev.off()

image.png

image.png
参考文献
- http://zzz.bwh.harvard.edu/plink/data.shtml
- http://zzz.bwh.harvard.edu/plink/metaanal.shtml