0. 先看监控的效果
一些基本信息:
项目所在机器的信息
I/O信息
jvm信息
等等等等
1. 介绍
Prometheus:
一个监控系统,集成在项目中可以对项目运行的一些情况进行监控,并将监控的数据存储在文件中,并可以通过自带的页面端查询到这些数据。
node_exporter:
一个监控系统,集成在服务器中,可以监控主机的运行状况,可以将node_exporter集成到Prometheus的管理端,通过Prometheus提供的页面查询到相应的数据
grafana:
一个显示页面,比Prometheus自带的更好看,更形象,可以通过给grafana配置Prometheus的数据源,让grafana显示Prometheus的数据。当然除了Prometheus,它也支持其他的数据源
2. 安装配置Prometheus,并监控Prometheus自身
2.1 下载Prometheus
下载地址:https://prometheus.io/download/
2.2 在Linux上安装Prometheus
-
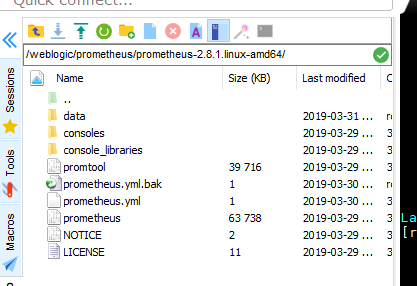
解压到linux中
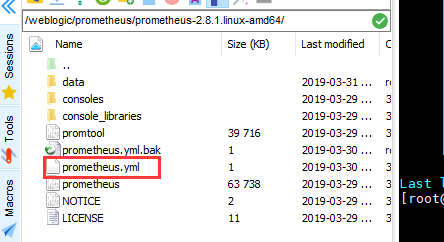
- 配置prometheus.yml(只监控Prometheus自身不需要修改任何东西)
# my global config
global:
  scrape_interval:     15s # Set the scrape interval to every 15 seconds. Default is every 1 minute.
  evaluation_interval: 15s # Evaluate rules every 15 seconds. The default is every 1 minute.
  # scrape_timeout is set to the global default (10s).

# Alertmanager configuration
alerting:
  alertmanagers:
  - static_configs:
    - targets:
      # - alertmanager:9093

# Load rules once and periodically evaluate them according to the global 'evaluation_interval'.
rule_files:
  # - "first_rules.yml"
  # - "second_rules.yml"

# A scrape configuration containing exactly one endpoint to scrape:
# Here it's Prometheus itself.
scrape_configs:
  # The job name is added as a label `job=` to any timeseries scraped from this config.
  - job_name: 'prometheus'

    # metrics_path defaults to '/metrics'
    # scheme defaults to 'http'.

    static_configs:
    - targets: ['localhost:9090']
- 启动Prometheus
./prometheus --config.file=prometheus.yml
2.3 查看Prometheus采集的数据和网页端
- 查看Prometheus采集的数据
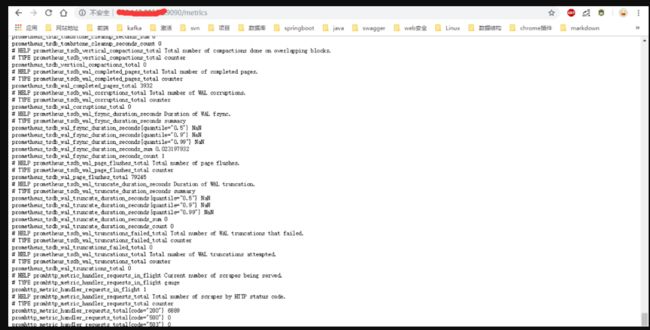
访问:http://ip:9090/metrics,ip是安装Prometheus的Linux机器地址,就可以看到Prometheus采集的数据
- 通过Prometheus的网页端查询数据
访问:http://ip:9090/graph
3. 安装配置node_exporter,监控Prometheus自身&利用node_exporter监控Linux机器
node_exporter可以采集linux机器的核数、内存、cpu、磁盘等等很多数据
3. 1 在linux机器上安装node_exporter
-
下载到Linux机器
地址:https://prometheus.io/download/#node_exporter
-
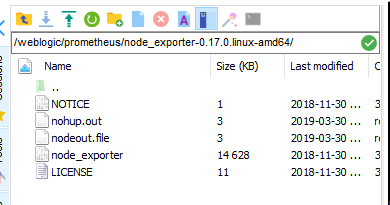
解压后的内容
启动node_exporter
./node_exporter
ps:这种方式启动会将此进程启动到前台,当把当前的命令行关闭,这个进程也会跟着关闭,可以把进程启动到后台运行:
nohup ./node_exporter> nodeout.file 2>&1 &
终端输出存会放在当前目录下的nodeout.file文件中
3. 2 查看node_exporter采集到的数据
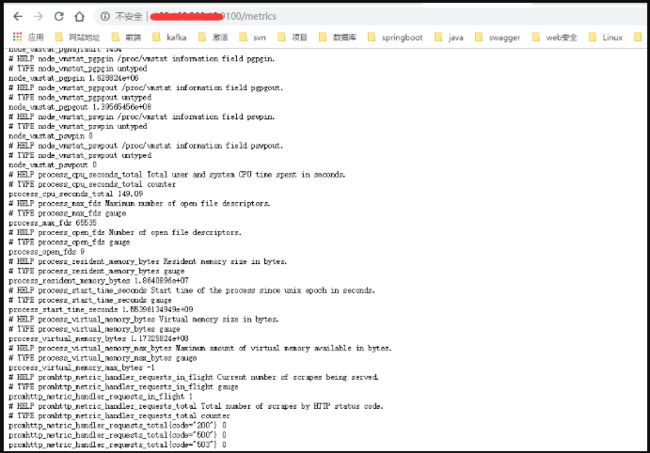
地址:http://ip:9100/metrics,注意端口是9100
3. 3 将node_exporter配置到Prometheus中
修改Prometheus的配置文件
增加一个job,target是node_exporter的9100的地址:
重新启动Prometheus
./prometheus --config.file=prometheus.yml
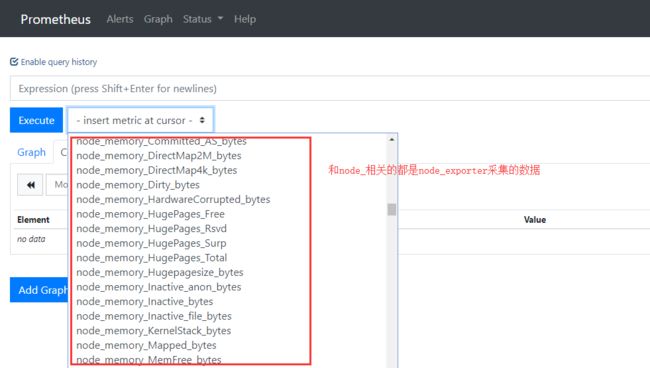
3. 4 利用Prometheus的查询页面查询node_exporter采集到的数据
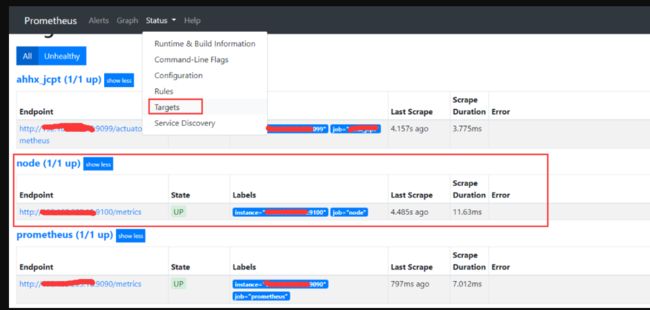
在status的target下也可以看到node_exporter的相关job信息
4. 集成Prometheus到spring boot项目,并利用Prometheus的查询页面查询spring boot项目的监控数据
4.1 添加maven
            org.springframework.boot
            spring-boot-starter-actuator


            io.micrometer
            micrometer-registry-prometheus
4.2 添加配置
management:
  endpoints:
    web:
      exposure:
        include:  '*'
  metrics:
    tags:
      application: ${spring.application.name}
4.3 在spring boot启动类下添加一个bean
public class BaseMainApp {
    public static void main(String[] args) {
        SpringApplication.run(BaseMainApp.class, args);
    }

    //看这里
    @Bean
    MeterRegistryCustomizer configurer(@Value("${spring.application.name}") String applicationName) {
        return (registry) -> registry.config().commonTags("application", applicationName);
    }
}
4.4 配置Prometheus的yml配置文件,添加job
然后重新启动Prometheus:
./prometheus --config.file=prometheus.yml
4.5 拦截器的坑
本来到这里应该是已经配置好了,但是如果你的spring boot设置了拦截器对访问的url进行拦截的话,一定要记得将下面这个地址开放出来,不然虽然采集到了数据,但是这些数据无法访问的话,Prometheus的查询就查询不到。
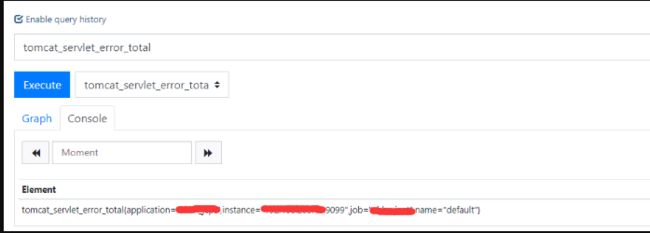
4.6 在Prometheus的查询页面查询spring boot的相关信息
首先在target下可以看到spring boot项目的job信息,并且status是up状态,表示一切正常,如果不是up状态,或者看不到spring boot项目的job信息,则不正常
5. 使用grafana来显示数据
上面每次都要输入查询语句来查看数据,非常的麻烦而且不直观,现在使用grafana来显示数据
5.1 安装grafana
此为独立部分,自行百度,此处省略
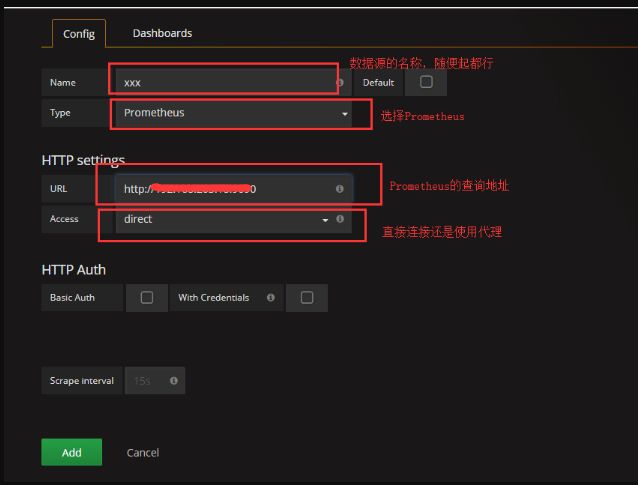
5.2 给grafana添加数据源
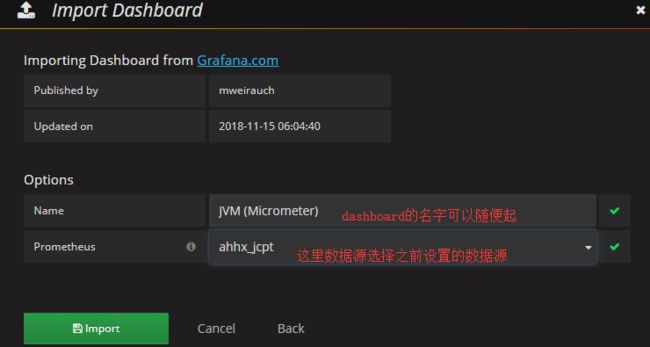
5.3 选择一个dashboard
导入完成后就可以在相应的dashboard中看数据了
5.4 关于dashboard
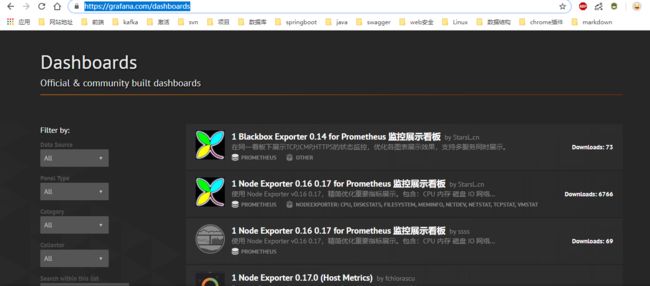
dashboard的网址https://grafana.com/dashboards
点击想要的dashboard就可以拿到其id或者json
但是,我发现很多的dashboard都不能用,会显示空白。所以有时候还是得自己创建或者修改dashboard。
本人就是在4701的基础上修改dashboard,添加了许多东西。
5.5 编辑dashboard
如果找到了比较满意有可以用的dashboard,则不需要这一步了
想要编辑dashboard,我们需要知道两个东西,一个是如何编辑这个图表,比如饼图,折线图等等,第二个是需要查询语句。
5.5.1 编辑图表
示例-饼图:
其他的图使用也都差不多,随便点一点都可以通过效果变化,猜到某些属性的作用
5.5.2 获取查询语句
这个比较复杂,比如堆内存使用率的查询语句:
sum(jvm_memory_used_bytes{application="$application", instance="$instance", area="heap"})*100/sum(jvm_memory_max_bytes{application="$application",instance="$instance", area="heap"})
很难短时间内掌握的明白
我们可以这么做,我们可以在dashboard中下载dashboard的json文件,虽然很多dashboard不能直接用,但是它的json文件中会包含相应的查询语句,我们可以把这些查询语句找出来,然后修改一些参数就可以了。
比如上面的堆内存使用率的语句,我只需要将application设置成自己的$application,instance设置成自己的$instance就可以了,
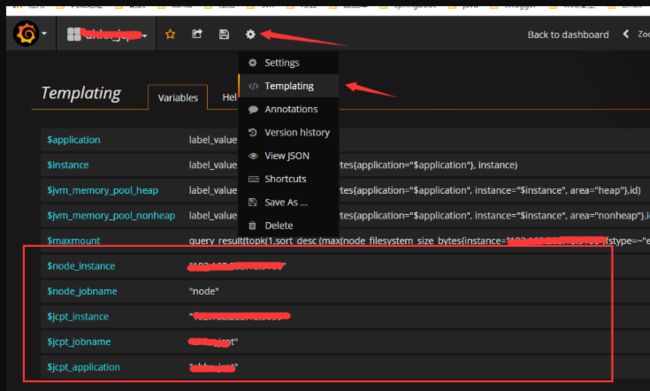
可以在模板中设置好$application和$instance,在查询语句中直接引用,
甚至不使用Templating,直接在查询语句中写死,比如这样:
sum(jvm_memory_used_bytes{application="ahhx_jcpt", instance="ip:9099", area="heap"})*100/sum(jvm_memory_max_bytes{application="ahhx_jcpt",instance="ip:9099", area="heap"})
然后写完这个语句以后,我们可以放到这里来执行,看语句是否写错
6. 总结
node_exporter是监控机器的,如果不需要,只需要监控spring boot项目运行的一些东西,都可以不用node_exporter
其实过程都是采集spring boot的metrics数据,或者linux机器的metrics数据,或者Prometheus自身的metrics数据,然后将对应的采集数据称为endpoint,以job的形式配置在Prometheus的配置文件中,Prometheus提供一个查询的页面,来查询各个metrics中的数据。
grafana只是一个显示的工具,我们把数据源提供给它,它也是通过调用Prometheus的接口,利用Prometheus来查询到各个数据的。


