0.引言
本文是在学习《Python数据分析与挖掘实战》时的一个记录,文中代码可点击下载,对书中部分代码进行改动以适应新版本。同时感谢https://github.com/apachecn/python_data_analysis_and_mining_action前辈无私分享的资料。
1.问题提出与建模
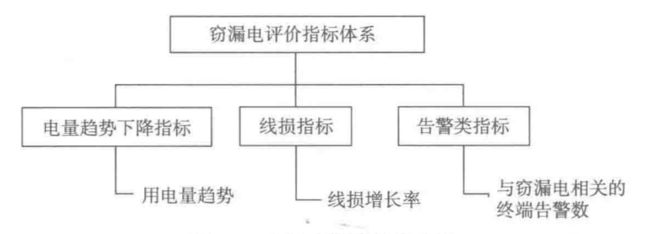
现有的电力计量自动化系统能采集到各相电流、电压、功率因数等信息,能一定程度反映用户窃漏电行为,因此建立如下评估指标体系来对用户数据特征进行描述:
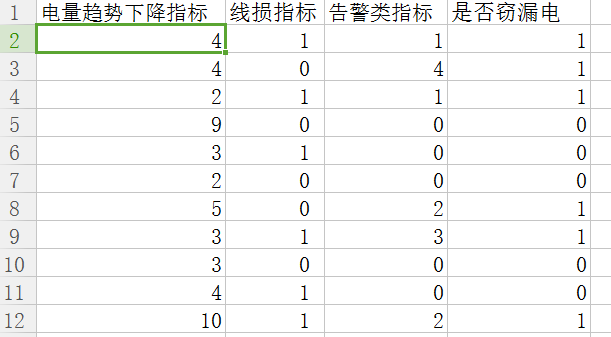
在数据库中选取291组样本数据,输入为电量趋势下降指标、线损指标和告警类指标,输出数据是否窃电。
对于这个分类问题,分别采用cart决策树和LM神经网络模型进行处理。
2.拉格朗日插值
实际应用中原始数据某些点会缺值,通常可以采取删除该项,补平均数、插值补全等方式处理。调用scipy中的lagrange函数进行处理,利用前后共10个数据得出缺失值。代码如下:
import pandas as pd
from scipy.interpolate import lagrange

inputfile = './data/missing_data.xls'
outputfile = './data/missing_data_processed.xls'
data = pd.read_excel(inputfile, header=None)

def ployinterp_columns(s,n,k=5):
    y = s[list(range(n-k,n))+list(range(n+1,n+1+k))]
    y = y[y.notnull()]
    return lagrange(y.index, list(y))(n)


for i in data.columns:
    for j in range(len(data)):
        if (data[i].isnull())[j]:
            data[i][j] = ployinterp_columns(data[i],j)

data.to_excel(outputfile,header=None,index=False)
3.LM神经网络
使用Keras(2.2.4)库建立神经网络(在TensorFlow1.11.0基础上),网络模型为3:10:1,,使用Adam方法求解。代码如下:
import pandas as pd
from random import shuffle
from keras.models import Sequential
from keras.layers.core import Dense,Activation
import matplotlib.pyplot as plt
from sklearn.metrics import confusion_matrix, roc_curve

def cm_plot(y, yp):
    cm = confusion_matrix(y, yp)

    plt.matshow(cm, cmap=plt.cm.Greens)
    plt.colorbar()

    for x in range(len(cm)):
        for y in range(len(cm)):
            plt.annotate(
                cm[x, y],
                xy=(x, y),
                horizontalalignment='center',
                verticalalignment='center')

    plt.ylabel('True label')
    plt.xlabel('Predicted label')
    return plt
#import data
datafile = 'data/model.xls'
data = pd.read_excel(datafile)
data = data.as_matrix()#将表格转化为矩阵
shuffle(data)
#数据分割
p = 0.8
train = data[:int(len(data)*p),:]#对行的操作
test = data[:int(len(data)*p),:]
#模型搭建
netfile = 'tmp/net.model'

net = Sequential()
net.add(Dense(10,input_shape=(3, )))
net.add(Activation('relu'))
net.add(Dense(1,input_shape=(10, )))
net.add(Activation('sigmoid'))
net.compile(loss = 'binary_crossentropy',optimizer='adam', sample_weight_mode="binary")

net.fit(train[:,:3],train[:,3],nb_epoch=1000,batch_size=1)
net.save_weights(netfile)

predict_result = net.predict_classes(train[:,:3]).reshape(len(train))

cm_plot(train[:,3],predict_result).show()

fpr, tpr, thresholds = roc_curve(
    test[:, 3], predict_result, pos_label=1)
plt.plot(fpr, tpr, linewidth=2, label='ROC of LM', color='green')
plt.xlabel('False Positive Rate')
plt.ylabel('True Positive Rate')
# 设定边界范围
plt.ylim(0, 1.05)
plt.xlim(0, 1.05)
plt.legend(loc=4)
plt.show()
print(thresholds)
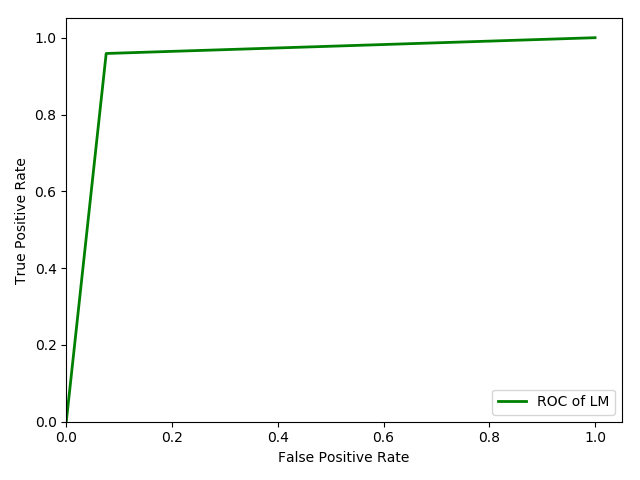
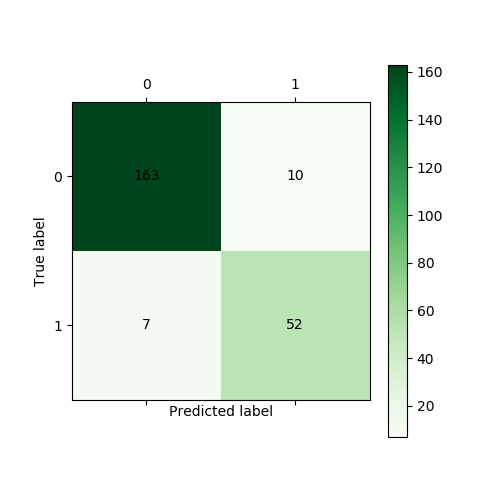
结果如图:
准确率为:(52+163)/(163+10+7+52)*100%=92.7%
混淆矩阵,ROC曲线具体定义可参照书本。
4.CART决策树
通过Scikit-Learn构建CART决策树模型,
from random import shuffle
import matplotlib.pyplot as plt
import pandas as pd
from sklearn.externals import joblib
from sklearn.metrics import confusion_matrix, roc_curve
from sklearn.tree import DecisionTreeClassifier

def cm_plot(y, yp):
    cm = confusion_matrix(y, yp)

    plt.matshow(cm, cmap=plt.cm.Greens)
    plt.colorbar()

    for x in range(len(cm)):
        for y in range(len(cm)):
            plt.annotate(
                cm[x, y],
                xy=(x, y),
                horizontalalignment='center',
                verticalalignment='center')

    plt.ylabel('True label')
    plt.xlabel('Predicted label')
    return plt

datafile = 'data/model.xls'
data = pd.read_excel(datafile)
data = data.as_matrix()
shuffle(data)  # 随机打乱数据

# 设置训练数据比8:2
p = 0.8
train = data[:int(len(data) * p), :]
test = data[int(len(data) * p):, :]

# 构建CART决策树模型
treefile = 'tmp/tree.pkl'
tree = DecisionTreeClassifier()
tree.fit(train[:, :3], train[:, 3])

joblib.dump(tree, treefile)

cm_plot(train[:, 3], tree.predict(train[:, :3])).show()  # 显示混淆矩阵可视化结果
# 注意到Scikit-Learn使用predict方法直接给出预测结果。

fpr, tpr, thresholds = roc_curve(
    test[:, 3], tree.predict_proba(test[:, :3])[:, 1], pos_label=1)
plt.plot(fpr, tpr, linewidth=2, label='ROC of CART', color='green')
plt.xlabel('False Positive Rate')
plt.ylabel('True Positive Rate')
# 设定边界范围
plt.ylim(0, 1.05)
plt.xlim(0, 1.05)
plt.legend(loc=4)
plt.show()
print(thresholds)
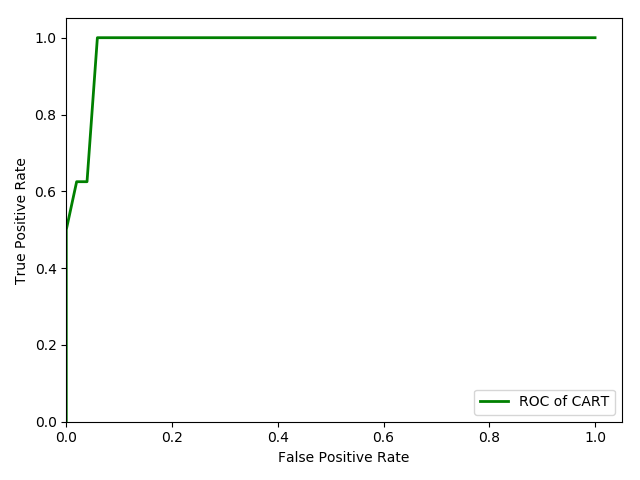
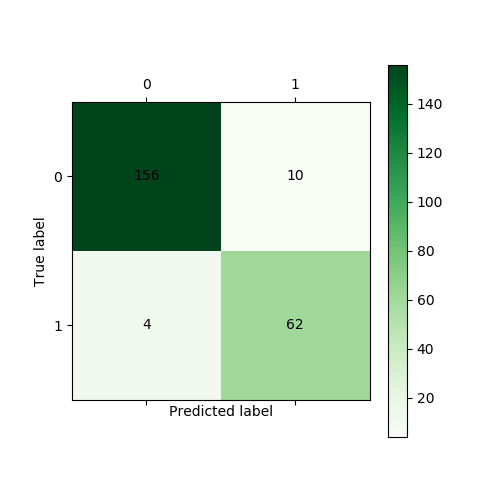
结果如图:
准确率为:(65+156)/(156+10+4+62)*100%=95.3%
5.结论
1.没有对神经网络进行细致调参训练,因此模型结果较差;
2.模型结果有一定随机性,和书上并不完全一致。
