1. 引言
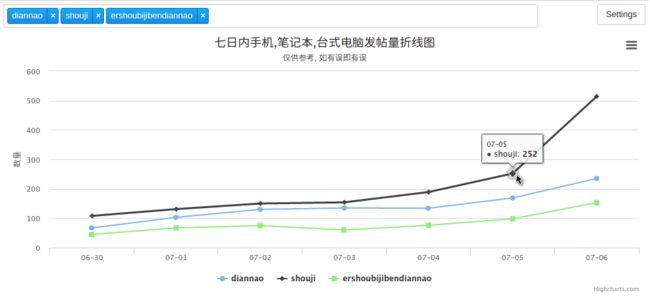
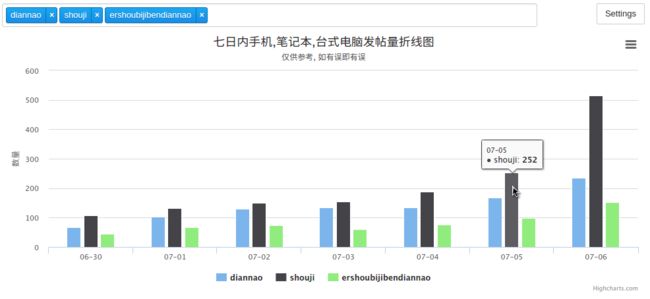
统计上图这3个类目在最近7日内, 发帖量随时间的变化情况, 并用折线图绘制出来.
2. 分析
- 生成日期
- 统计各分类发帖次数
- 生成图表数据
3. 实现
In [1] :
from pymongo import MongoClient
from datetime import timedelta, date
import charts
Server running in the folder /home/wjh at 127.0.0.1:40077
In [2] :
client = MongoClient('10.66.17.17', 27017)
database = client['ganji']
item_info_collection = database['sh_ershou_itemY']
In [3] :
# 查看有哪些分类
cate_set = set([i['cate'] for i in item_info_collection.find()])
# 输出看下
print(cate_set)
{'shuma', 'xianzhilipin', 'jiaju', 'diannao', 'bangong', 'meironghuazhuang', 'fushixiaobaxuemao', 'yingyouyunfu', 'xuniwupin', 'ruanjiantushu', 'shouji', 'laonianyongpin', 'ershoubijibendiannao', 'rirongbaihuo', 'nongyongpin', 'jiadian'}
In [4] :
# 定义要查看的分类列表
cates = ['diannao', 'shouji', 'ershoubijibendiannao']
In [5] :
# 定义日期生成函数
def cate_date_gen(date1, date2):
    # 起始日
    little_date = date(2016, int(date1.split('-')[0]), int(date1.split('-')[1]))
    # 结束日
    end_date = date(2016, int(date2.split('-')[0]), int(date2.split('-')[1]))
    # 日期增加步长
    step = timedelta(days=1)
    # 循环生成日期
    while little_date <= end_date:
        yield little_date.strftime('%m-%d')
        # 增加日期
        little_date += step
# 输出看下
[i for i in cate_date_gen('07-01', '07-07')]
Out [5] :
['07-01', '07-02', '07-03', '07-04', '07-05', '07-06', '07-07']
In [6] :
# 定义图表数据生成函数
def cate_data_gen(types, date1, date2):
    # 在指定日期内循环
    for cate in cates:
        # 分类出现次数列表
        cate_posts = []
        # 循环统计分类出现次数
        for date in cate_date_gen(date1, date2):
            # 一种分类出现的所有条目列表
            finds = list(item_info_collection.find({'update': date, 'cate': cate}))
            # 此分类出现的次数
            count = len(finds)
            # 将此分类出现的次数添加进列表
            cate_posts.append(count)
        # 生成一个数据字典
        data = {
            'name': cate,
            'data': cate_posts,
            'type': types,
        }
        # 每次数据返回都从上次循环结束位置开始
        yield data
# 输出看下
[i for i in cate_data_gen('line', '06-30', '07-06')]
Out [6] :
[{'data': [67, 103, 130, 135, 134, 169, 235],
  'name': 'diannao',
  'type': 'line'},
 {'data': [108, 131, 150, 154, 189, 252, 514],
  'name': 'shouji',
  'type': 'line'},
 {'data': [45, 67, 75, 60, 76, 98, 153],
  'name': 'ershoubijibendiannao',
  'type': 'line'}]
In [7] :
# 定义图表参数
option = {
    'char': {'zoomType': 'xy'},
    'title': {'text': '七日内手机,笔记本,台式电脑发帖量折线图'},
    'subtitle': {'text': '仅供参考, 如有误即有误'},
    'xAxis': {'categories': [i for i in cate_date_gen('06-30', '07-06')]},
    'yAxis': {'title': {'text': '数量'}},
}
In [8] :
# 生成折线图表数据
serise = [i for i in cate_data_gen('line', '06-30', '07-06')]
# 展示图表折线图
charts.plot(serise, show='inline', options=option)
Out [8]:
In [9] :
# 生成柱状图表数据
serise = [i for i in cate_data_gen('column', '06-30', '07-06')]
# 展示图表柱状图
charts.plot(serise, show='inline', options=option)
Out [9] :
4. 总结
-
highcharts的折线``柱状图表数据就是一个字典列表 - 定义函数生成格式化数据很方便

