1.标题和标签
import matplotlib.pyplot as plt
x = [1,2,3]
y = [5,7,4]
x2 = [1,2,3]
y2 = [10,14,12]

#画两个线条,并添加注释
plt.plot(x,y,label='first line')
plt.plot(x2,y2,label='second line')
#x轴和y轴添加注释
plt.xlabel('number')
plt.ylabel('value')
#给整个表加名字
plt.title("helloworld!")
#生成默认图例
plt.legend()
#显示
plt.show()
2.条形图
import matplotlib.pyplot as plt

#plt.bar创建条形图,label添加标签,color设置颜色
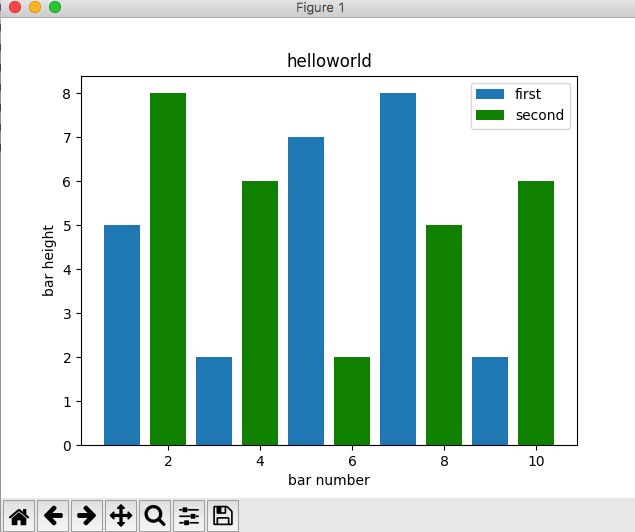
plt.bar([1,3,5,7,9],[5,2,7,8,2],label='first')
plt.bar([2,4,6,8,10],[8,6,2,5,6],label='second',color='g')
#坐标轴设置标签
plt.xlabel('bar number')
plt.ylabel('bar height')
#标题
plt.title('helloworld')
#生成默认图例
plt.legend()
#显示
plt.show()
3.直方图
import matplotlib.pyplot as plt

#所有年龄
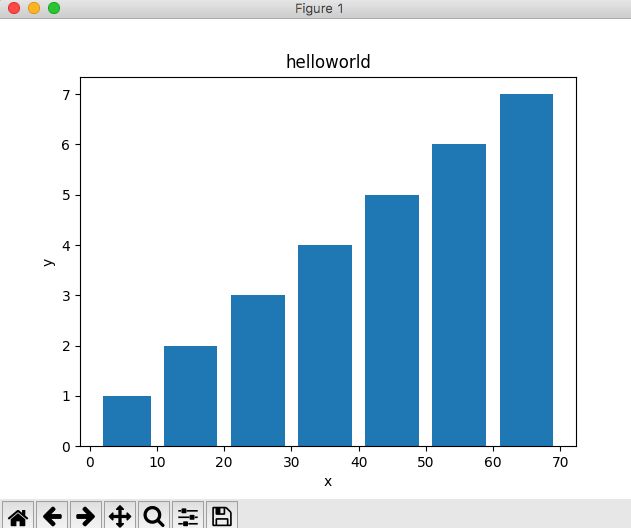
ages = [6,12,13,21,22,23,31,32,33,34,41,42,43,44,45,51,51,51,51,51,51,61,61,61,61,61,61,61]
#分段统计
bins = [1,10,20,30,40,50,60,70]

#首先放入所有的值,然后指定放入哪个桶或容器。将条形的宽度设为0.8
plt.hist(ages, bins, histtype='bar', rwidth=0.8)
#坐标轴设置标签
plt.xlabel('x')
plt.ylabel('y')
#标题
plt.title('helloworld')
#生成默认图例
plt.legend()

#显示
plt.show()
4.散点图
import matplotlib.pyplot as plt

x = [1,2,3,4,5,6,7,8]
y = [5,2,4,2,1,4,5,2]

# s设置标记点大小,marker设置标记点样式
plt.scatter(x,y, label='skitscat', color='r', s=35, marker="o")
#坐标轴设置标签
plt.xlabel('x')
plt.ylabel('y')
#标题
plt.title('helloworld')
#生成默认图例
plt.legend()

#显示
plt.show()
5.堆叠图
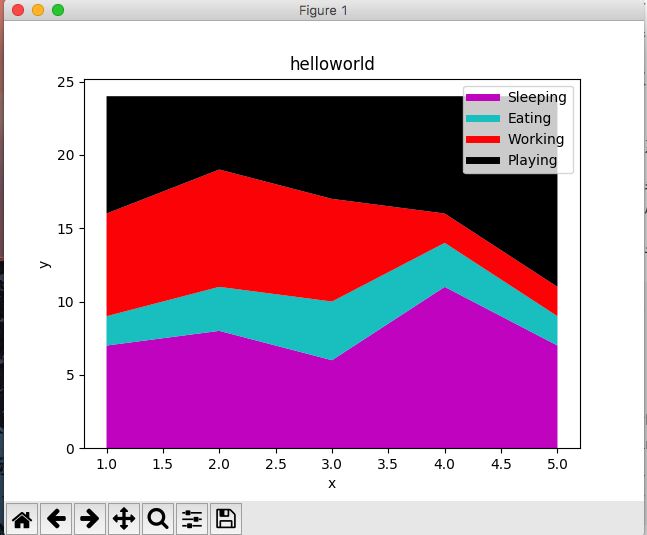
#5天中每天的各种行为时间分配
import matplotlib.pyplot as plt

days = [1,2,3,4,5]

sleeping = [7,8,6,11,7]
eating =   [2,3,4,3,2]
working =  [7,8,7,2,2]
playing =  [8,5,7,8,13]

#画一些空行,给予它们符合我们的堆叠图的相同颜色,和正确标签。 我们还使它们线宽为5
plt.plot([],[],color='m', label='Sleeping', linewidth=5)
plt.plot([],[],color='c', label='Eating', linewidth=5)
plt.plot([],[],color='r', label='Working', linewidth=5)
plt.plot([],[],color='k', label='Playing', linewidth=5)

#x轴包括day变量,y轴包括sleeping,eating,working,playing
plt.stackplot(days, sleeping,eating,working,playing, colors=['m','c','r','k'])
#坐标轴设置标签
plt.xlabel('x')
plt.ylabel('y')
#标题
plt.title('helloworld')
#生成默认图例
plt.legend()

#显示
plt.show()
6.饼图
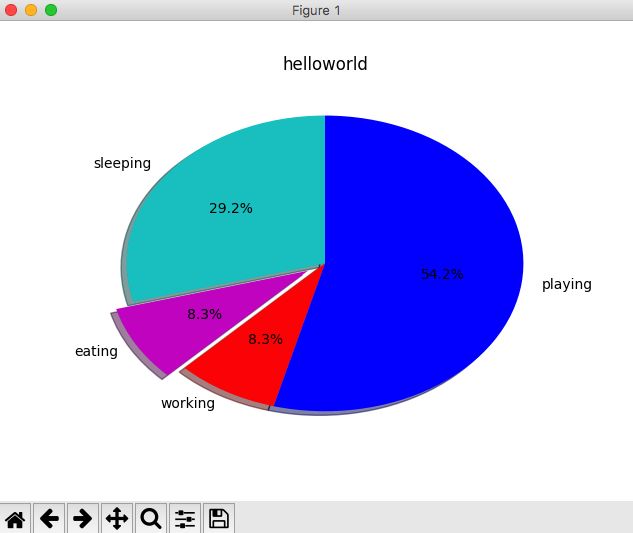
在plt.pie中,我们需要指定『切片』,这是每个部分的相对大小。 然后,我们指定相应切片的颜色列表。 接下来,我们可以选择指定图形的『起始角度』。 这使你可以在任何地方开始绘图。 在我们的例子中,我们为饼图选择了 90 度角,这意味着第一个部分是一个竖直线条。 接下来,我们可以选择给绘图添加一个字符大小的阴影,然后我们甚至可以使用explode拉出一个切片。
我们总共有四个切片,所以对于explode,如果我们不想拉出任何切片,我们传入0,0,0,0。 如果我们想要拉出第一个切片,我们传入0.1,0,0,0。

最后,我们使用autopct,选择将百分比放置到图表上面。
import matplotlib.pyplot as plt

slices = [7,2,2,13]
activities = ['sleeping','eating','working','playing']
cols = ['c','m','r','b']

plt.pie(slices,labels=activities,colors=cols,startangle=90,shadow=True,explode=(0,0.1,0,0),autopct='%1.1f%%')
#标题
plt.title('helloworld')
#显示
plt.show()
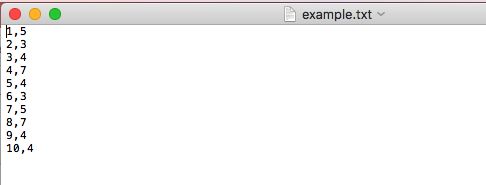
7.从文件加载数据
#使用csv模块读取数据
import matplotlib.pyplot as plt
import csv

x = []
y = []

with open('example.txt','r') as csvfile:
    #csv读取器自动按行分割文件,然后使用分隔符分割文件中的数据
    plots = csv.reader(csvfile, delimiter=',')
    for row in plots:
        #我们将索引为 0 的元素存储到x列表,将索引为 1 的元素存储到y列表中
        x.append(int(row[0]))
        y.append(int(row[1]))

plt.plot(x,y, label='Loaded from file!')
plt.xlabel('x')
plt.ylabel('y')
plt.title('Interesting Graph\nCheck it out')
plt.legend()
plt.show()
#使用NumPy模块读取数据
import matplotlib.pyplot as plt
import numpy as np

x, y = np.loadtxt('example.txt', delimiter=',', unpack=True)
plt.plot(x,y, label='Loaded from file!')

plt.xlabel('x')
plt.ylabel('y')
plt.title('Interesting Graph\nCheck it out')
plt.legend()
plt.show()
8.子图
import random
import matplotlib.pyplot as plt
from matplotlib import style

style.use('fivethirtyeight')

fig = plt.figure()
def create_plots():
    xs = []
    ys = []

    for i in range(10):
        x = i
        y = random.randrange(10)

        xs.append(x)
        ys.append(y)
    return xs,ys
x1,y1 = create_plots()
x2,y2 = create_plots()
x3,y3 = create_plots()

ax1 = fig.add_subplot(221)
ax1.plot(x1,y1)

ax2 = fig.add_subplot(222)
ax2.plot(x2,y2)
ax3 = fig.add_subplot(212)
ax3.plot(x3,y3)
plt.show()
9.

