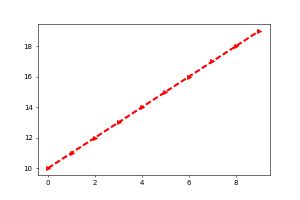
折线图
import matplotlib.pyplot as plt
import numpy as np
x=np.arange(0,10,1) #创建一个0-10之间以1为间隔的numpy数组
y=x+10
plt.plot(x,y,color='red',linestyle='--',marker='>',linewidth=3,label='example one')  #绘制图形
plt.savefig('first.png',dpi=50)  #保存图形,dpi表示
plt.legend()   #显示图例
plt.show()   #显示图形
图形展示
说明
plt.plot()可以直接绘制折线,其中marker是折线上的标记,linewidth是折线的宽度,label是图例,如果要想显示就要设置plt.legend(),linestyle是折线的风格,color是颜色
饼状图
import matplotlib.pyplot as plt

slices = [2,3,4,9]   #指定每一个切片的大小,这里就是每块的比例
activities = ['sleeping','eating','working','playing']   #指定标签
cols = ['c','m','r','b']   #y颜色

plt.pie(slices,
        labels=activities,
        colors=cols,   #指定每一个区块的颜色
        startangle=90,     #开始角度,默认是0度,从x轴开始,90度从y轴开始
        shadow= True,    #阴影效果
        explode=(0,0.1,0,0),     #拉出第二个切片,如果全为0就不拉出,这里的数字是相对与圆心的距离
        autopct='%1.1f%%')       #显示百分比
plt.title('Interesting Graph\nCheck it out')  #设置标题
plt.show()
图片展示
散点图
import numpy as np
import matplotlib.pyplot as plt
x=np.random.rand(1000)
y=np.random.rand(len(x))
plt.scatter(x,y,color='r',alpha=0.3,label='example one',marker='o')  #绘图
plt.legend()
#plt.axis([0,2,0,2]) #设置坐标的范围
plt.show()
图片展示
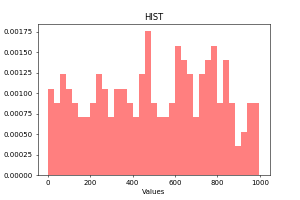
直方图
import matplotlib.pyplot as plt
import numpy as np
x=np.random.randint(1,1000,200)
axis=plt.gca()   #得到当前的绘图对象
axis.hist(x,bins=35,facecolor='r',normed=True,histtype='bar',alpha=0.5)#bins表示直方图的个数,histtype表示直方图的样式,normed如果为True就将直方归一化,显示概率密度,默认是False
axis.set_xlabel("Values")  #设置x的标签
axis.set_ylabel("Frequency")
axis.set_title("HIST")
plt.show()
图片展示


