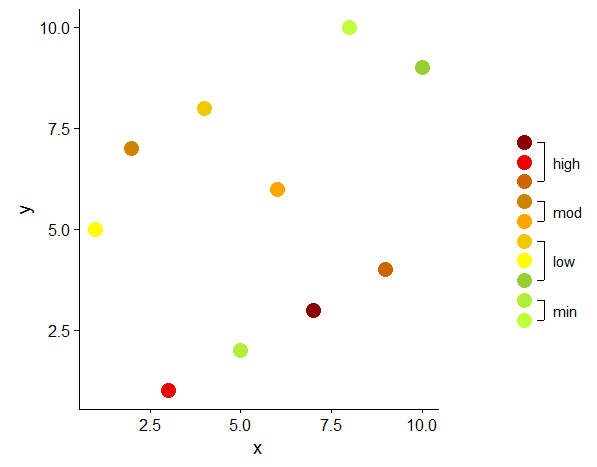
看到一个有意思的东西。。。。
原文链接: Add annotation and segments to groups of legend elements
主要绘制下面这个图的右边那一块
思维: 利用 cowplot 函数进行拼接
cowplotcut()unlist
data.table(x = 1, y = unlist(d2[ , .(y, yend)]))
-
:=:
d[ , grp := cut(as.numeric(z), breaks = c(0, 2, 5, 7, 11),
                labels = c("min", "low", "mod", "high"))]
d[ , .(x = 1, y = min(y), yend = max(y), ymid = mean(y)), by = grp]
library(data.table)
library(ggplot2)
library(cowplot)

# 'original' data
dt <- data.table(x = sample(1:10), y = sample(1:10), z = sample(factor(1:10)))

# color vector
# 设定颜色,避免 ggplot2 绘图过才
cols <- c("1" = "olivedrab1", "2" = "olivedrab2",            # min
          "3" = "olivedrab3", "4" = "yellow", "5" = "gold2", # low
          "6" = "orange1", "7" = "orange3",                  # moderate
          "8" = "darkorange3", "9" = "red2", "10" = "red4")  # high

# original plot, without legend
# 刚开始就一个不要 legend 的普通散点图
p1 <- ggplot(data = dt, aes(x = x, y = y, color = z)) +
  geom_point(size = 5) +
  scale_color_manual(values = cols, guide = FALSE)

# create data to plot the legend
# 为 legend 创造数据
# x and y to create a vertical row of points
# all levels of the variable to be represented in the legend (here z)
# 从图例可以看出,是 x 轴固定不变,y 轴高度在变
d <- data.table(x = 1, y = 1:10, z = factor(1:10))
d
    x  y  z
 1: 1  1  1
 2: 1  2  2
 3: 1  3  3
 4: 1  4  4
 5: 1  5  5
 6: 1  6  6
 7: 1  7  7
 8: 1  8  8
 9: 1  9  9
10: 1 10 10

# 使用 cut() 函数将数据按照大小分类。即 (0, 2] 为 min、(2, 5] 为 low 等等, 左开右闭。
# 这函数挺好用的。
# 这里还需注意 `:=` ,我是第一次见。。
# cut z into groups which should be displayed as text in legend
d[ , grp := cut(as.numeric(z), breaks = c(0, 2, 5, 7, 11),
                labels = c("min", "low", "mod", "high"))]
d
    x  y  z  grp
 1: 1  1  1  min
 2: 1  2  2  min
 3: 1  3  3  low
 4: 1  4  4  low
 5: 1  5  5  low
 6: 1  6  6  mod
 7: 1  7  7  mod
 8: 1  8  8 high
 9: 1  9  9 high
10: 1 10 10 high

# calculate the start, end and mid points of each group
# used for vertical segments
# 这里尼玛用的真的妙。按照 grp 分组,每一组对应一行。
d2 <- d[ , .(x = 1, y = min(y), yend = max(y), ymid = mean(y)), by = grp]
d2
    grp x y yend ymid
1:  min 1 1    2  1.5
2:  low 1 3    5  4.0
3:  mod 1 6    7  6.5
4: high 1 8   10  9.0

# unlist 妙用。
# end points of segments in long format, used for horizontal 'ticks' on the segments
d3 <- data.table(x = 1, y = unlist(d2[ , .(y, yend)]))
d3
   x  y
1: 1  1
2: 1  3
3: 1  6
4: 1  8
5: 1  2
6: 1  5
7: 1  7
8: 1 10

# offset (trial and error)
v <- 0.3

# plot the 'legend'
p2 <- ggplot(mapping = aes(x = x, y = y)) +
  geom_point(data = d, aes(color = z), size = 5) +
  geom_segment(data = d2,
               aes(x = x + v, xend = x + v, yend = yend)) +
  geom_segment(data = d3,
               aes(x = x + v, xend = x + (v - 0.1), yend = y)) +
  geom_text(data = d2, aes(x = x + v + 0.4, y = ymid, label = grp)) +
  scale_color_manual(values = cols, guide = FALSE) +
  scale_x_continuous(limits = c(0, 2)) +
  theme_void()

# combine original plot and custom legend
plot_grid(p1,
          plot_grid(NULL, p2, NULL, nrow = 3, rel_heights = c(1, 1.5, 1)),
          rel_widths = c(3, 1))
