computeGCbias
- 网页介绍很详细: https://deeptools.readthedocs.io/en/develop/content/tools/computeGCBias.html
-
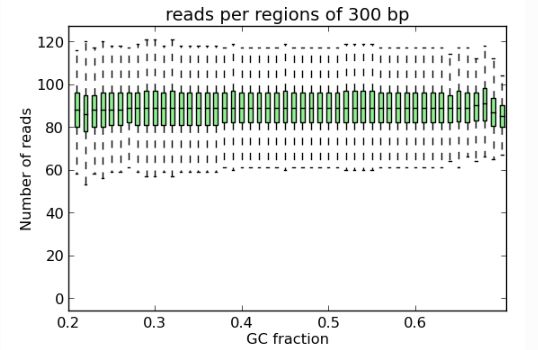
-b后加sorted bam,--effectiveGenomeSize可以在网页里根据链接找到,--genome后是2bit格式的基因组序列,-freq后是输出的freq文件路径,--biasPlot后是输出的可视化结果;
wkd=/xiaojuan/xjqi/chipseq
computeGCBias -b ${wkd}/03mapping/ChIP-Seq_Pho_SppsKO_2.bam --effectiveGenomeSize 162367812 --genome ${wkd}/reference/dm3.2bit -l 200 -freq ${wkd}/gc_test/frequencies_data.txt --region chr2L --biasPlot ${wkd}/gc_test/test_gc.png 2>/xiaojuan/xjqi/chipseq/log/computeGCbias.log2
deeptools的一个功能,用来计算GCbias,所参考的文献是,Benjamini’s method [Benjamini & Speed (2012). 文章所说的GCbias是指,在GC-rich和AT-rich区域均有counts被低估的现象。
背景知识:基于假设,理想样本在整个基因组的reads覆盖应该是一致,与碱基组成无关;但实际过程中,DNA聚合酶会倾向于富集GC-rich的区域,因此便会对测序结果产生影响;(
当初在PCR的时候,曾经见到过一个组分叫GC enhancer,这让我跟GC bias的认知冲突了好久,查资料说,GC enchancer的考虑是退火温度)-
计算原理:
computeGCbias首先统计每个GC含量(特定长度的基因组区域的G或C的数目)下的固定长度DNA片段的数量(expected GC profile),这样会得到一个相应的直方图,每个物种对应不同的结果,与实验无关;然后统计每个GC含量下的测序reads数目( observed GC profile);理论值和实际值的比较,得到相应的GCbias;
correctGCbias
-
-b后加sorted bam,--effectiveGenomeSize可以在网页里根据链接找到,--genome后是2bit格式的基因组序列,-freq后computeGCbias生成的结果,-o后跟校正后的bam文件;
wkd=/xiaojuan/xjqi/chipseq
correctGCBias -b ${wkd}/03mapping/ChIP-Seq_Pho_SppsKO_2.bam --effectiveGenomeSize 162367812 --genome ${wkd}/reference/dm3.2bit --GCbiasFrequenciesFile ${wkd}/gc_test/frequencies_data.txt -o ${wkd}/gc_test/gc_corrected.bam 2>/xiaojuan/xjqi/chipseq/log/correctGCbias.log2
【参考内容】
- https://deeptools.readthedocs.io/en/develop/content/tools/computeGCBias.html

