前言
华罗庚说过
数缺形时少直观,形少数时难入微.
这句话第一次听还是初中数学老师上二次方程课时说的.最近看到了3blue1brown对线性代数的直观解释感觉豁然开朗,于是我又捡起了儿时对美妙数学的兴趣. 发现一个博客,数据可视化很好的例子,决定花些时间和大家一起解读一下
例程来自:https://www.machinelearningplus.com/plots/matplotlib-histogram-python-examples//
感谢b站UP "菜菜TsaiTsai" 分享这个博客.
简单回顾下上期内容,我们的目标是在一张图上展示多个维度信息,例如购买口红时我们会参考他的销量、色号、价格等等参数,当我们把每个品牌的口红个个参数都体现在一张图上时这些点会有某种分布的趋势。这个趋势在总样本越多时越明显。这期我们要综合之前的散点图和直方图来展示。
例7
# Import Data
df = pd.read_csv("https://raw.githubusercontent.com/selva86/datasets/master/mpg_ggplot2.csv")

# Create Fig and gridspec
fig = plt.figure(figsize=(16, 10), dpi= 80)
grid = plt.GridSpec(4, 4, hspace=0.5, wspace=0.2)

# Define the axes
ax_main = fig.add_subplot(grid[:-1, :-1])
ax_right = fig.add_subplot(grid[:-1, -1], xticklabels=[], yticklabels=[])
ax_bottom = fig.add_subplot(grid[-1, 0:-1], xticklabels=[], yticklabels=[])

# Scatterplot on main ax
ax_main.scatter('displ', 'hwy', s=df.cty*4, c=df.manufacturer.astype('category').cat.codes, alpha=.9, data=df, cmap="tab10", edgecolors='gray', linewidths=.5)

# histogram on the right
ax_bottom.hist(df.displ, 40, histtype='stepfilled', orientation='vertical', color='deeppink')
ax_bottom.invert_yaxis()

# histogram in the bottom
ax_right.hist(df.hwy, 40, histtype='stepfilled', orientation='horizontal', color='deeppink')

# Decorations
ax_main.set(title='Scatterplot with Histograms \n displ vs hwy', xlabel='displ', ylabel='hwy')
ax_main.title.set_fontsize(20)
for item in ([ax_main.xaxis.label, ax_main.yaxis.label] + ax_main.get_xticklabels() + ax_main.get_yticklabels()):
    item.set_fontsize(14)

xlabels = ax_main.get_xticks().tolist()
ax_main.set_xticklabels(xlabels)
plt.show()
解析
我们上期提过一个问题,在一个平面上如何展示超过3个特征的维度信息。当时的答案有,x,y坐标,等高线法,标记颜色。上例采用了一个更简单暴力的方法:再画一个图。
解析下代码流程
- 导入数据表
- 分割画布
- 设置画布尺寸,和其他2个画布尺寸
- 画图,需要画1幅散点图,2幅直方图
- 标注 图表的头和轴的名字等等信息
方法参数解释
- plt.GridSpec(4, 4,hspace=0.5, wspace=0.2) 把画布分为 4x4 高为0.5单位,宽为0.2单位
- ax_bottom.invert_yaxis() 把y 轴作为很水平轴
图像
应用
这里我们学到一个图形分割的方法。把一个长方形分成4分,去3x3面积作为主画面,剩下的1x4和4x1 大小作为辅助的画面。你可以找一张纸画画看,这让我想起小学时做的那些数学题。来看图像这次我们有更加量化的图像,但还是不够。因为加入让你来描述这张图表,表示什么,你可能很难回答。我们需要把具体再回到概括,不过这次用一个数值来概括。看下一个例子
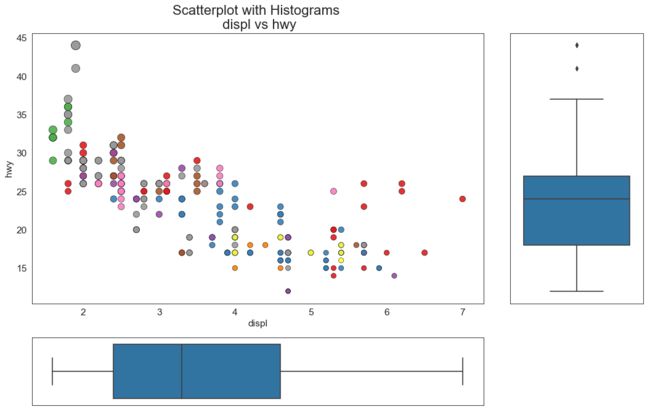
例8
# Create Fig and gridspec
fig = plt.figure(figsize=(16, 10), dpi= 80)
grid = plt.GridSpec(4, 4, hspace=0.5, wspace=0.2)

# Define the axes
ax_main = fig.add_subplot(grid[:-1, :-1])
ax_right = fig.add_subplot(grid[:-1, -1], xticklabels=[], yticklabels=[])
ax_bottom = fig.add_subplot(grid[-1, 0:-1], xticklabels=[], yticklabels=[])

# Scatterplot on main ax
ax_main.scatter('displ', 'hwy', s=df.cty*5, c=df.manufacturer.astype('category').cat.codes, alpha=.9, data=df, cmap="Set1", edgecolors='black', linewidths=.5)

# Add a graph in each part
sns.boxplot(df.hwy, ax=ax_right, orient="v")
sns.boxplot(df.displ, ax=ax_bottom, orient="h")

# Decorations ------------------
# Remove x axis name for the boxplot
ax_bottom.set(xlabel='')
ax_right.set(ylabel='')

# Main Title, Xlabel and YLabel
ax_main.set(title='Scatterplot with Histograms \n displ vs hwy', xlabel='displ', ylabel='hwy')

# Set font size of different components
ax_main.title.set_fontsize(20)
for item in ([ax_main.xaxis.label, ax_main.yaxis.label] + ax_main.get_xticklabels() + ax_main.get_yticklabels()):
    item.set_fontsize(14)

plt.show()
解析
这是第二次用到 seabron 包,他除了配色好看,还直接帮你计算了,中值、回归线这些东西
解析下代码流程
- 分割画布
- 设置画布大小
- 画图,一幅散点图,2幅箱图
- 添加标注
方法参数解释
sns.boxplot(df.hwy, ax=ax_right, orient="v")
- 输入为一个一维数列。
- ax 可以用 matplotlib 的画布作为输入画布
- orient 设置方向
图像
应用
再箱图中的横线就是这个样本的中位数,现在我们可以描述这个图了,市场上主流排量车型时3.2L,主流的油耗在每英里25加仑。
下期预告
下期我们将做一次总结,不在介绍新的统计图。事实上对于非专业统计员而言,散点图,折线图,直方图,箱图,已经能应对生活中99.9%场景了。这次总结我们会完整且详细的把一个表格变成一幅漂亮而且有意义的图表。
下期预告:统计50图——总结与宝可梦游戏数值统计

