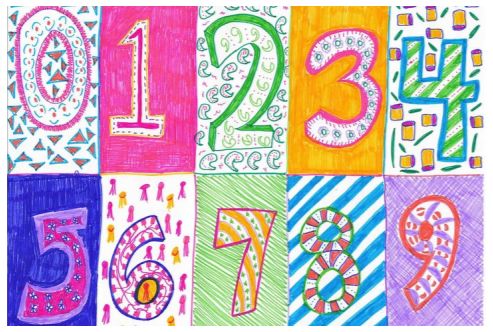
MNIST就是机器学习的Hello World, 或者说图片处理的Lena, 是必不可少的经典初体验。它已有20多年的历史,但是到今天依然魅力不减,依然是最高引用的数据集。MNIST只包含70000张28x28像素的手写数字的单通道灰度图,对于现在的算力来说是很小的数据。
网上大多数的MNIST教程,包括TensorfFlow官方教程带给我们的都是一种自然主义的学习体验,给出代码示例简单教会步骤,对着代码敲一下就能运行,毕竟参与感不够。从结构主义的学习方式来看,我们应该至少尝试一次不用任何深度学习的现成框架,纯手工从零开始实现一次神经网络,并且打开其中的黑盒,以可视化的呈现方式形象理解神经网络如何工作,这就是我写此文的目的。
数据准备 (Data Preparation)
MNIST数据集中Train dataset有60000张图片与相应的标注,其中55000张训练集,5000张验证集(Validation),Test dataset有10000张训练集,下载完这四个文件后我保存到MNIST-data目录下。
train-images-idx3-ubyte.gz: training set images (9912422 bytes)
train-labels-idx1-ubyte.gz: training set labels (28881 bytes)
t10k-images-idx3-ubyte.gz: test set images (1648877 bytes)
t10k-labels-idx1-ubyte.gz: test set labels (4542 bytes)
数据集就是这么四个文件,都是特殊的Binary格式。解析起来费点功夫,不过TensorFlow已封装好了便利的接口 - input_data.read_data_sets。虽然这次我不用TensorFlow框架的神经网络,但是解析数据部分借用一下无妨。这个函数会自动尝试下载数据集到指定目录中,不过强烈建议自己手工下载好这四个文件,由于不可描述的原因,用这个方法直接下载数据基本都是以time out失败告终。第一个参数是指定的数据集存放路径,第二个参数决定是否以独热键(one-hot)形式读取标签,如果设为True则以10维向量形式代表一个数字。
mndata = input_data.read_data_sets("MNIST-data/", one_hot=True)
分别获取训练集和测试集的图片和标注
X_train=mndata.train.images # training set
y_train=mndata.train.labels
X_test=mndata.test.images # testing set
y_test=mndata.test.labels
然后写一个画图的函数,读取矩阵数据在表格中展示,仅展示非0数字且保留两位小数。
# visualize grid data of a matrix, zero cell shown as empty
def plt_grid(data):
fig, ax = plt.subplots()
fig.set_size_inches(30,30)
width, height = data.shape#imshow portion
imshow_data = np.random.rand(width, height)
ax.imshow(imshow_data, cmap=plt.cm.Pastel1, interpolation='nearest')for x in range(0, height):
for y in range(0, width):
if (data[y][x]>0):
ax.text(x, y, np.round(data[y][x],2), va='center', ha='center', fontsize=20)
plt.show()
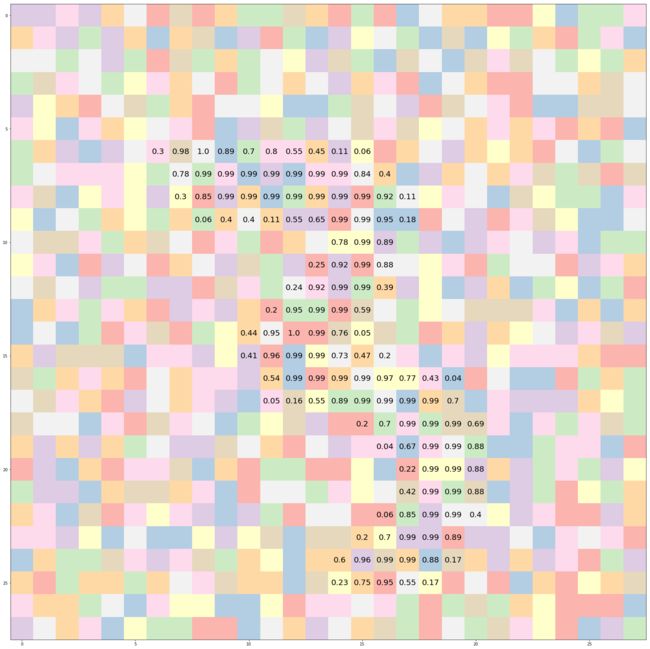
随便找个吉利数字88作为index, 从训练集中抽一张图片打印原始数据看看这个28x28的矩阵里到底存放了什么
plt_grid(X_train[88].reshape(28,28))
非0的数值本身就已经能看到数字的形状了,是个3. 数值越接近1表示颜色越白,边缘的颜色应该是比较灰的,而背景数值为0自然就是黑色。
打印相应的标签出来也是3: [ 0. 0. 0. 1. 0. 0. 0. 0. 0. 0.]
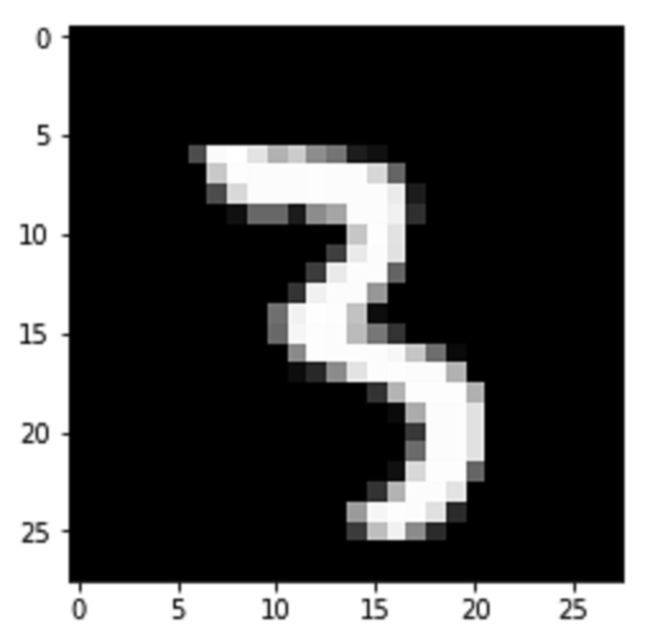
下面我再直接把图片抽出来打印对比一下,果不其然, 和上图长的一模一样。
网络架构 (Network Layouts)
数据准备好后就开始设计神经网络了, 简单一点就三层: input layer, hidden layer, output layer
input layer(输入层)的节点就是要喂给神经网络的像素值,共784个节点。
hidden layer(隐藏层)可以让网络在抽象层次上学习特征,虽然我只放一层,但是也可以有多层。少量隐藏层会得到浅层神经网络SNN,隐藏层很多时就是深层神经网络DNN。理论上,单隐藏层神经网络也可以逼近任何连续函数,只要神经元数量够多。如果增加隐藏层或者隐藏层神经元的数量,神经网络的容量会变大,空间表达能力会变强,但如果太多的话也容易过拟合。先暂定15个节点吧。
output layer(输出层)有10个节点,因为图片要分类映射到十个数字上。
权重和偏差 (Weights and Bias)
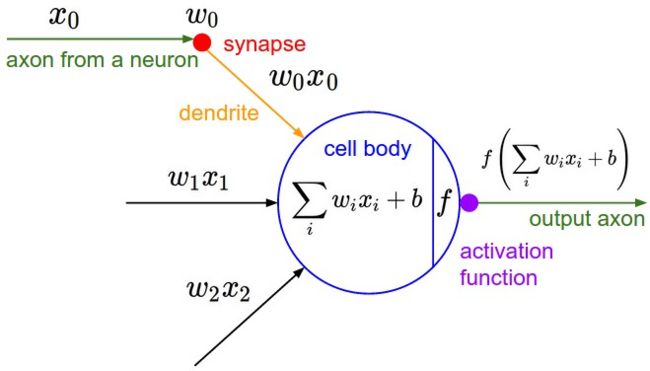
上图中两个神经元之间的每一条连线都代表一个权重值,神经网络通过不断调整权重来逼近结果。首先把一组权重应用在input layer的节点上,加上偏差值后得到hidden layer的节点,然后对hidden layer的节点应用另一组权重,加上偏差值后最终得到output layer的节点。
先设置一下两组权重和偏差的初始值,后面再看如何更新这些权重和偏差。我定义一个模型训练函数,目标是不断优化权重和偏差得到最佳组合。第一组权重是一个784 x 15的矩阵,第二组权重是一个15 x 10的矩阵,用随机函数生成一堆0到1之间的浮点数值,偏差就先都设为0. 两组权重都除以5是我在调参过程中发现初始权重数值要更小一些效果比较好,随便拍的一个数。
input_layer_size = 28 * 28
hidden_layer_size = 15
output_layer_size = 10def train_model():
# init weights and bias
np.random.seed(1)
W1 = np.random.random([input_layer_size, hidden_layer_size])/5 # 784 x 15
b1 = np.zeros((1, hidden_layer_size))
W2 = np.random.random([hidden_layer_size, output_layer_size])/5 # 15 x 10
b2 = np.zeros((1, output_layer_size))
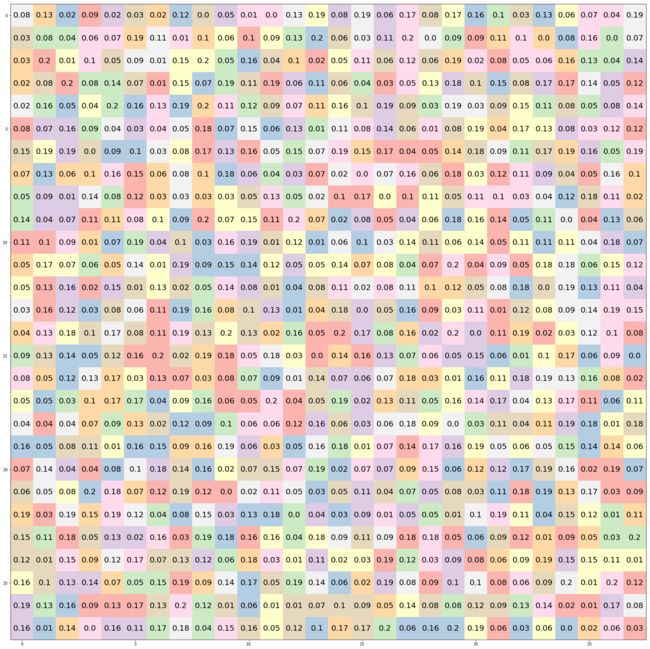
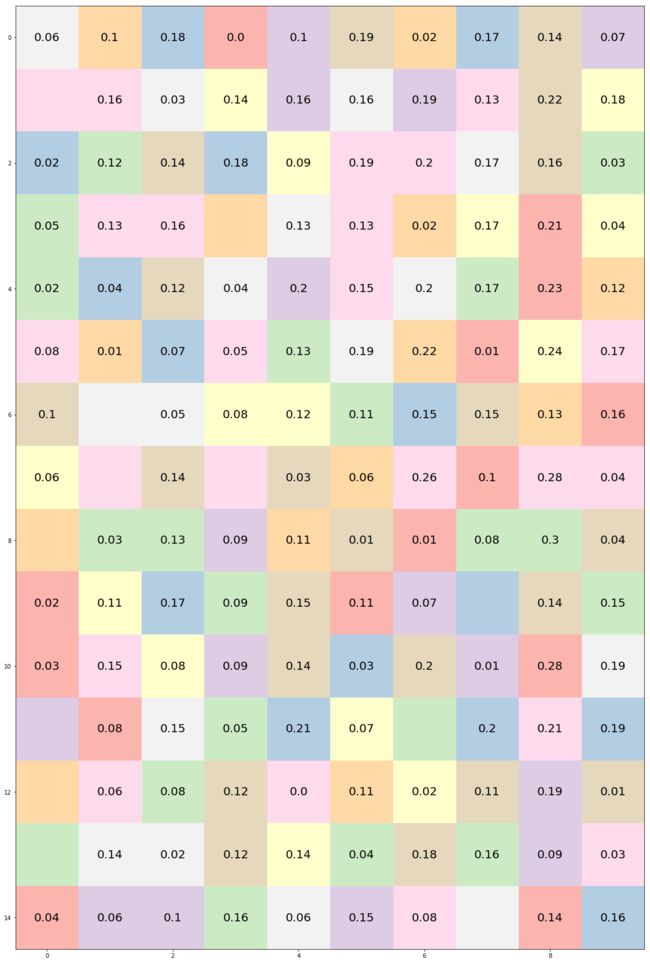
现在可以把权重W1也打印出来看看,我只拿输入层第一个节点和隐藏层第一个简单之间的一根线来查看。可以看到都是非常微小的随机数字,最大不会超过0.2
plt_grid(W1.T[0].reshape(28,28))
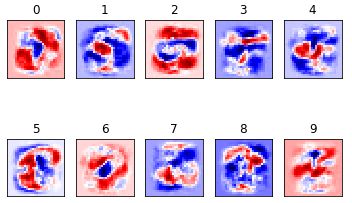
后来在训练50000次之后可以用plt将十个数字权重的热力图可视化呈现:
for i in range(10):
plt.subplot(2, 5, i+1)
weight = W1[:,i]
plt.title(i)
plt.imshow(weight.reshape([28,28]), cmap=plt.get_cmap('seismic'))
frame1 = plt.gca()
frame1.axes.get_xaxis().set_visible(False)
frame1.axes.get_yaxis().set_visible(False)
激活函数 (Activation Function)
Montreal 大学的 Bengio 教授在 ICML 2016 中给出了激活函数定义: 激活函数是映射 h:R→R,且几乎处处可导。
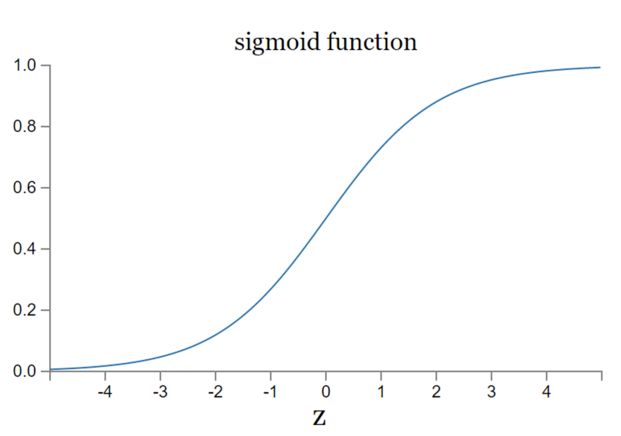
引入激活函数是为了将权值转化为分类结果,有多重选择: Sigmoid(S型), Tanh(双切正切), ReLu(只保留非零), Softmax(归一化) etc. 这些常用的激活函数多数都是非线性的,为了弥补线性函数区分度不够好的短板,而且激活函数要能保证数据输入与输出也是可微的。本来我尝试用Sigmoid作为激活函数,但是可能由于我的实现方式导致效果不好,准确率到70%多我就优化不下去了,可能它本身由于软饱和性也容易出现梯度消失的问题,只好暂时放弃。
上面这句话我再解释一下,Sigmoid就是处处可导的S型曲线,且两侧导数趋近于0,所以它是一个软饱和函数,而且左右两侧都是软饱和。一旦落入了软饱和区f'(x)就接近于0了,无法再继续传递梯度,这就是所谓的梯度消失。
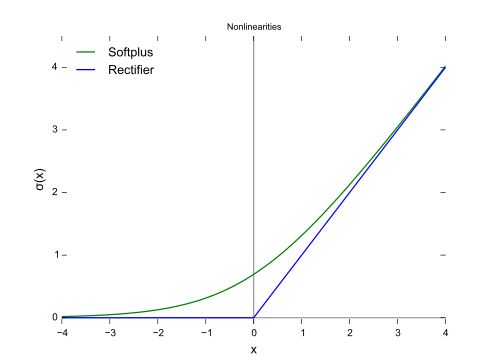
现在输入层到隐藏层我选择了ReLu作为激活函数,从图形中看出它具备左侧硬饱和的特性。
代码实现如下
def relu(x):
return np.maximum(x, 0)
从隐藏层到输出层我选择了softmax作为激活函数
序列中最大的那个数映射的分量逼近于 1, 其他就逼近于 0,非常适合多分类问题。取指数是为了让马太效应凸显,大数进一步放大,同时也满足了可导函数的需求。
Softmax代码实现如下 (如果出现overflow的话可以参考scikit-learn源码的实现方式)
def softmax(x):
e_x = np.exp(x - np.max(x))
return e_x / e_x.sum()
正向传播(Forward Propagation)
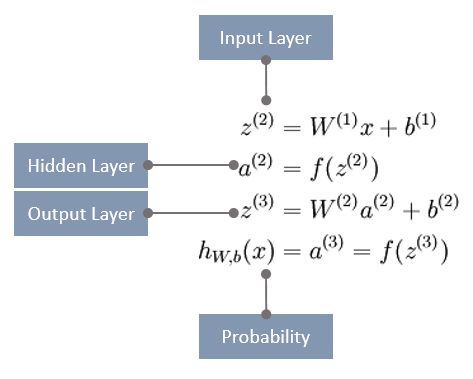
正向传播的计算就是把输入层到隐藏层的节点与权重和偏差结合,计算出输出层节点的过程。
对于这个三层网络,假定x是包含一个单一训练样本的列向量。则向量化的正向传播步骤如下:(这个图我画完以后感觉用更严谨的方式来描述的话,四个标注应该是隐藏层的输入,隐藏层的输出,输出层的输入,输出层的输入,但懒得改图了)
假设我要训练50000次,train_model方法中加入正向传播的循环代码实现如下
batch= 50000
for i in range(0, batch):
X = X_train[i]
y = y_train[i]input_layer = X.dot(W1)
hidden_layer = relu(input_layer + b1)
output_layer = np.dot(hidden_layer, W2) + b2
output_probs = softmax(output_layer)
我还是继续拿index为88的数字3图片为例看看各层是什么数字
input_layer是输入层矩阵与权重1矩阵相乘得到15维向量
hidden_layer是上一层加上偏差1作为ReLu的输入计算出来的, 维度同上
此时权重2是15x10的矩阵
权重2和hidden_layer矩阵相乘加上偏差2得到十维向量output_layer, 这里最大的数字是第九位的20.09
output_layer作为softmax输入计算后得到最终结果output_probs, 第九位被转成了非常接近1的一个小数,也是序列中最大的数字。这是训练之初的数值,实际上最大的数字应该在第四位,所以此时误差比较大。大概在学习3000次之后已经能较大概率的在第四位逼近1
反向传播 (Backward Propagation)
接下来自然就会思考,权重和偏差如何迭代优化呢? 首先正向传播计算出output_layer节点,用损失函数计算一下和标注y的差距,根据损失大小返回来修正权重和偏差,这个通过链式法则对多层复合函数求导的过程就是反向传播,其目标就是要最小化训练集上的累积误差。
在前文"人工神经元是如何模拟生物神经元的"中我提到机器学习需要不断调整weight和bias来逐步逼近预期的输出值,而且必须保证weight和bias的微小变化也只会带来输出值的微小变化.
调参的过程就像打高尔夫一样,目标是以最少的杆数将球打进洞,如果过于谨慎可能耗费的杆数太多,如果太过激进可能球被打进了沙池或者水坑,欲速则不达。每一杆都要让球离球洞更近,进入果岭的时候还要确保不要用力过度让球跑过头了。(见下文学习率)
在train_model方法中继续实现这个逆向过程, 计算输出层的error, 再将此error逆向传播到隐藏层,最后根据隐藏层的error来对连接权重与偏差进行调整,迭代循环下去不断更新让error收敛。核心逻辑是梯度下降的算法,这里有三种选择: 批量梯度下降(Batch Gradient Descent),随机梯度下降(Stochastic Gradient Descent)和小批量梯度下降。
第一种方式遍历完整训练集算出一个损失函数,然后更新参数再跑一次完整训练集,如此迭代循环,所以计算量很恐怖。第二种方式是每跑训练集中的一条数据就计算损失函数并更新参数,速度比较快,但收敛性不太好,可能会出现较多毛刺在最优点附近摇摆。最后一个是前两者的这种方案,既不是跑全量数据而不是跑单个数据,而是拿一小批数据来计算损失函数更新参数。我先用SGD来跑,后面可以通过图像看到毛刺的问题。
用数学语言来描述,梯度下降算法的核心是多元函数求微,针对每一个变量都分别求微,每一次迭代都用多元函数减去多元函数的微分与学习率的乘积。下面代码中第一行设置的参数是学习率,这个参数是要在精度和速度之间找到平衡,学习率太大则训练的快但精度不够(每次击球都很大力),学习率太小则提升精度但过于耗费时间(每次击球都小心翼翼轻轻挥杆保证精准),这里设置的学习率是固定的,这样的静态设置显然不会是最佳选择,不过处于学习目的也够了。
learning_rate = .01
reg_lambda = .01output_error = (output_probs - y) / output_probs.shape[0]
hidden_error = np.dot(output_error, W2.T)
hidden_error[hidden_layer <= 0] = 0# gradient layer2 weights and bias
g2_weights = np.dot(hidden_layer.T, output_error)
g2_bias = np.sum(output_error, axis = 0, keepdims = True)# gradient layer1 weights and bias
g1_weights = np.dot(X.reshape(input_layer_size,1), hidden_error)
g1_bias = np.sum(hidden_error, axis = 0, keepdims = True)# gradient descent parameter update
W1 -= learning_rate * g1_weights
b1 -= learning_rate * g1_bias
W2 -= learning_rate * g2_weights
b2 -= learning_rate * g2_bias
正则化干扰 (Regularization Terms)
为了让拟合效果更好可以在error后面加入正则干扰项, 让模型和样本不要完全拟合,当出现欠拟时干扰项的影响要小,当出现过拟时干扰项的影响要大。reg_lambda就是设置的拟合参数,所以可以在更新w和b之前再加两行代码。
# add regularization terms
g2_weights += reg_lambda * W2
g1_weights += reg_lambda * W1
预测函数
这个逻辑很简单,和训练集的正向传播完全一样,只不过输入参数换成测试集数据,代入已经训练好的权重和偏差,统计正确预测的比例。
input_layer = np.dot(X_test[:10000], W1)
hidden_layer = relu(input_layer + b1)
scores = np.dot(hidden_layer, W2) + b2
probs = softmax(scores)
print ('Test accuracy: {0}%'.format(accuracy(probs, y_test[:10000])))
完成模型训练代码后可以再定义一个交叉熵损失函数来观察收敛效果,迭代到三五千次的时候其实已经差不多了,后面的几万次学习依然会不时出现一些毛刺影响准确率。
def cross_entropy_loss(probs, y_onehot):
indices = np.argmax(y_onehot, axis = 0).astype(int)
predicted_prob = probs[np.arange(len(probs)), indices]
log_preds = np.log(predicted_prob)
loss = -1.0 * np.sum(log_preds) / len(log_preds)
return loss
最后把上面的代码重构一下整合起来贴出完整代码(不包含调试打印图片和日志),预测准确率90%, 下一篇我将改用TensorFlow对Fashion MNIST预测,并提升准确率。
import numpy as np
from tensorflow.examples.tutorials.mnist import input_data
import matplotlib.pyplot as plt
mndata = input_data.read_data_sets("MNIST-data/", one_hot=True)
X_train=mndata.train.images # training set
y_train=mndata.train.labels
X_test=mndata.test.images # testing set
y_test=mndata.test.labels
input_layer_size = 28 * 28
hidden_layer_size = 15
output_layer_size = 10
reg_lambda = .01
learning_rate = .01
# visualize grid data of a matrix, zero cell shown as empty
def plt_grid(data):
fig, ax = plt.subplots()
fig.set_size_inches(30,30)
width, height = data.shape
#imshow portion
imshow_data = np.random.rand(width, height, 2)
ax.imshow(imshow_data, cmap=plt.cm.Pastel1, interpolation='nearest')
for x in range(0, height):
for y in range(0, width):
if (data[y][x]>0):
ax.text(x, y, np.round(data[y][x],8), va='center',
ha='center', fontsize=20)
plt.show()
def softmax(x):
e_x = np.exp(x - np.max(x))
return e_x / e_x.sum()
def relu(x):
return np.maximum(x, 0)
def cross_entropy_loss(probs, y_onehot):
indices = np.argmax(y_onehot, axis = 0).astype(int)
predicted_prob = probs[np.arange(len(probs)), indices]
log_preds = np.log(predicted_prob)
loss = -1.0 * np.sum(log_preds) / len(log_preds)
return loss
# init weights and bias
def init_weights_bias():
np.random.seed(1)
W1 = np.random.random([input_layer_size, hidden_layer_size])/5 # 784 x 15
b1 = np.zeros((1, hidden_layer_size))
W2 = np.random.random([hidden_layer_size, output_layer_size])/5 # 15 x 10
b2 = np.zeros((1, output_layer_size))
model = { 'W1': W1, 'b1': b1, 'W2': W2, 'b2': b2}
return model
# derivative weights and bias
def derivative_weights_bias(output_error, hidden_layer, X, model):
W1, _, W2, _ = model['W1'], model['b1'], model['W2'], model['b2']
hidden_error = np.dot(output_error, W2.T)
hidden_error[hidden_layer <= 0] = 0
# gradient layer2 weights and bias
g2_weights = np.dot(hidden_layer.T, output_error)
g2_bias = np.sum(output_error, axis = 0, keepdims = True)
# gradient layer1 weights and bias
g1_weights = np.dot(X.reshape(input_layer_size,1), hidden_error)
g1_bias = np.sum(hidden_error, axis = 0, keepdims = True)
# add regularization terms
g2_weights += reg_lambda * W2
g1_weights += reg_lambda * W1
param = { 'dW1': g1_weights, 'db1': g1_bias, 'dW2': g2_weights, 'db2': g2_bias}
return param
def forward_propagation(X, model):
W1, b1, W2, b2 = model['W1'], model['b1'], model['W2'], model['b2']
input_layer = np.dot(X, W1)
hidden_layer = relu(input_layer + b1)
output_layer = np.dot(hidden_layer, W2) + b2
probs = softmax(output_layer)
return probs, hidden_layer
def accuracy(predictions, labels):
preds_correct_boolean = np.argmax(predictions, 1) == np.argmax(labels, 1)
correct_predictions = np.sum(preds_correct_boolean)
accuracy = 100.0 * correct_predictions / predictions.shape[0]
return accuracy
#predict test set
def predict(X, model):
W1, b1, W2, b2 = model['W1'], model['b1'], model['W2'], model['b2']
input_layer = np.dot(X_test[:10000], W1)
hidden_layer = relu(input_layer + b1)
output_layer = np.dot(hidden_layer, W2) + b2
probs = softmax(output_layer)
print ('Test accuracy: {0}%'.format(accuracy(probs, y_test[:10000])))
# - batch: Size of passes through the training data for gradient descent
def train_model(batch, X, y):
model = init_weights_bias()
W1, b1, W2, b2 = model['W1'], model['b1'], model['W2'], model['b2']
# Gradient descent. For each batch...
for i in range(0, batch):
output_probs, hidden_layer = forward_propagation(X[i], model)
output_error = (output_probs - y[i]) / output_probs.shape[0]
param = derivative_weights_bias(output_error, hidden_layer, X[i], model)
dW1, db1, dW2, db2 = param['dW1'], param['db1'], param['dW2'], param['db2']
# gradient descent parameter update
W1 -= learning_rate * dW1
b1 -= learning_rate * db1
W2 -= learning_rate * dW2
b2 -= learning_rate * db2
model = { 'W1': W1, 'b1': b1, 'W2': W2, 'b2': b2}
loss = cross_entropy_loss(output_probs, y[i])
if (i % 2000 == 0):
print('loss @ %d is %f' % (i, loss))
return model
model = train_model(50000, X_train[:50000], y_train[:50000])
predict(X_test[:10000], model)
References:
Neural Network Vectorization
Neural Network and Deep Learning
Not another MNIST tutorial with TensorFlow OReilly Media
