from kaggle:
https://www.kaggle.com/zynicide/wine-reviews
分析思路:
0、数据准备
1、葡萄酒的种类
2、葡萄酒质量
3、葡萄酒价格
4、葡萄酒描述词库
5、品鉴师信息
6、总结
0、数据准备
0.1 模块及数据导入
导入所需数据模块:
import pandas as pd
import numpy as np
import matplotlib.pyplot as plt
%matplotlib inline
plt.rcParams['font.sans-serif']=['SimHei'] #用来正常显示中文标签
plt.rcParams['axes.unicode_minus']=False #用来正常显示负号
import seaborn as sns
导入数据,并检查数据的完整性:
wine1=pd.read_csv('/Users/ranmo/Desktop/数据分析案例/Wine Reviews/wine-reviews/winemag-data_first150k.csv')
wine2=pd.read_csv('/Users/ranmo/Desktop/数据分析案例/Wine Reviews/wine-reviews/winemag-data-130k-v2.csv')
#两个表的数据类型是一致的,合并两个表
wine=pd.concat([wine1,wine2],ignore_index=True,sort=False)
wine=wine.drop(labels='Unnamed: 0',axis=1)
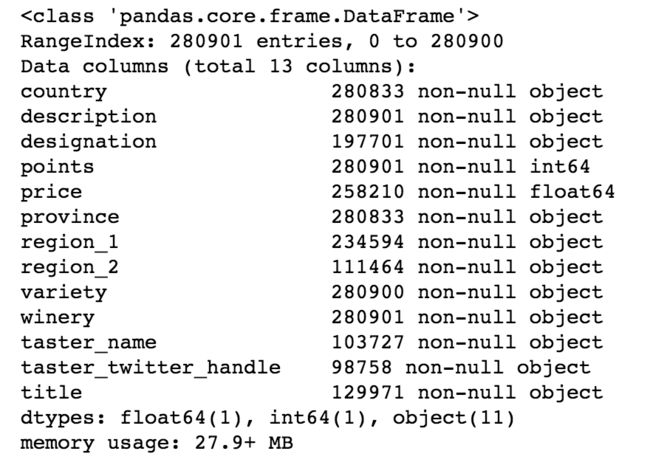
wine.info()
0.2 对wine表进行处理:
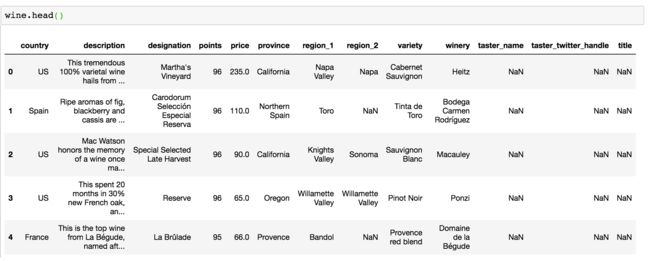
wine表共含有13个字段,每个字段共280901行,分别解释为:
- country:产出国
- description:描述
- designation:葡萄酒名称
- points:得分
- price:价格
- province:产出省
- region_1:产出区域1
- region_2:产出区域2
- variety:品种
- winery:酒厂
- taster_name:品鉴师
- taster_twitter_handle:品鉴师推特号
- title:头衔(不懂这个是什么)
对wine表进行数据清洗:
(1)数据去重:
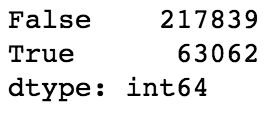
wine.duplicated().value_counts()
wine=wine.drop_duplicates()
#进一步检查,发现存在很多字段都重复的数据,认为是重复数据并将其清除
dupilicated_index=list(wine[wine[['country','description','designation','province','points','price']].duplicated()].index)
wine=wine.drop(labels=dupilicated_index,axis=0)
wine.reset_index(drop=True)
(2)不良数据处理
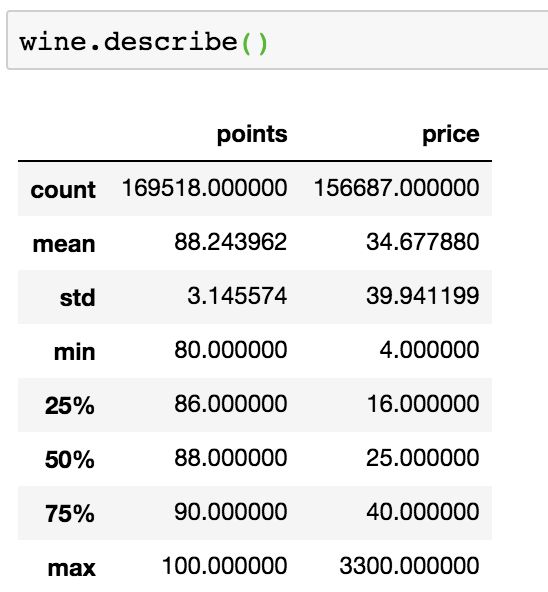
经查看,points和price两项数据均在合理区间,故无不良数据。
数据经过处理后:
下面的分析主要围绕以下几个方面开展:
- 葡萄酒种类,以及在各个国家的主要分布情况;
- 葡萄酒得分情况,分析葡萄酒质量最好的国家和地区;
- 葡萄酒价格情况,分析不同葡萄酒种类的价格,分析价格和得分的关系,挖掘性价比最高的葡萄酒种类;
- 提取葡萄酒描述关键词,建立不同种类葡萄酒的关键词库,当用户输入描述关键词时,可以反馈最匹配的葡萄酒种类;
- 提取品鉴师的信息并建立品鉴师信息库,用户可查看品鉴师排行榜及分类排行榜,同时提供相关品鉴师twitter联系方式查询。
1、葡萄酒的种类
1.1 种类总体分布
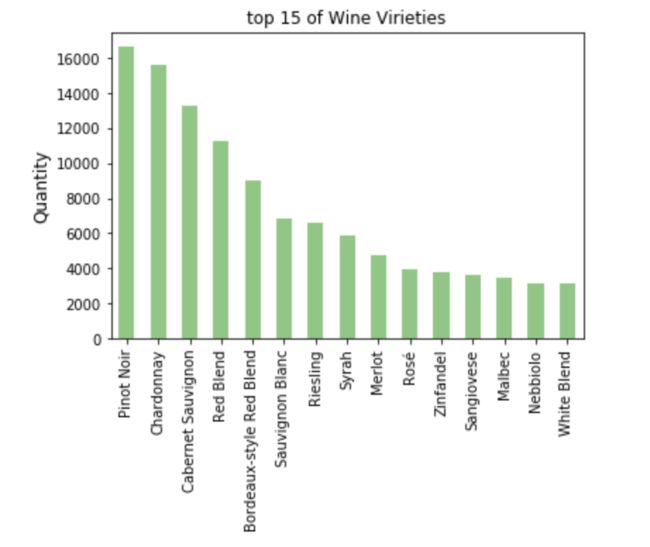
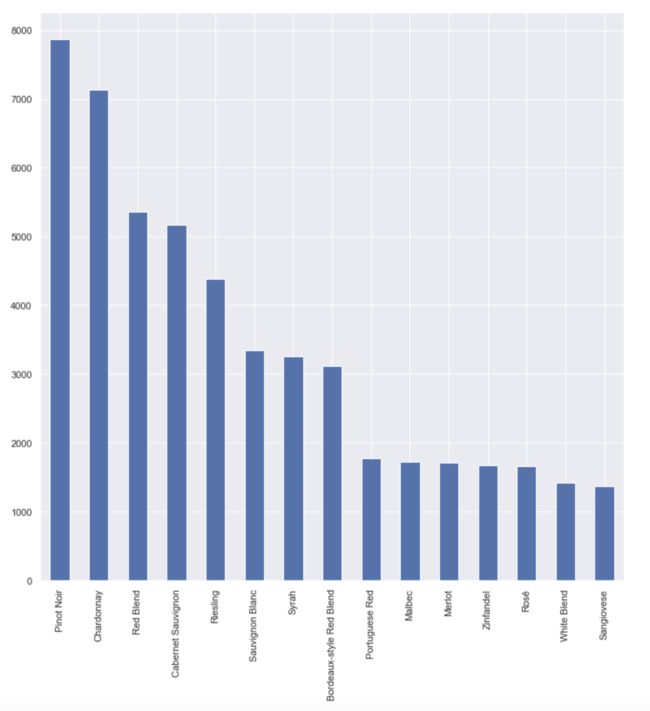
temp=wine.variety.value_counts()[0:15]
ax=temp.plot(kind='bar',title='top 15 of Wine Virieties',colormap='Accent')
plt.ylabel('Quantity',fontsize=12)
- 数量最多的葡萄酒种类有Pinot Noir 、Chardonnay 、Cabernet Sauvignon等等。
1.2 不同国家的种类分布
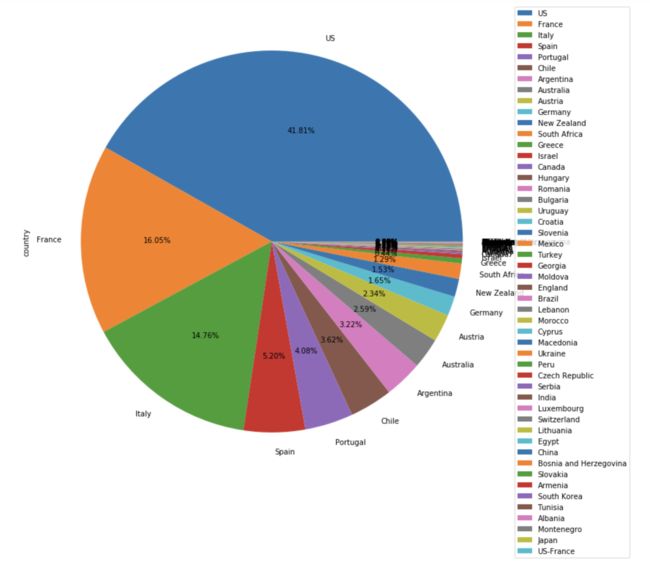
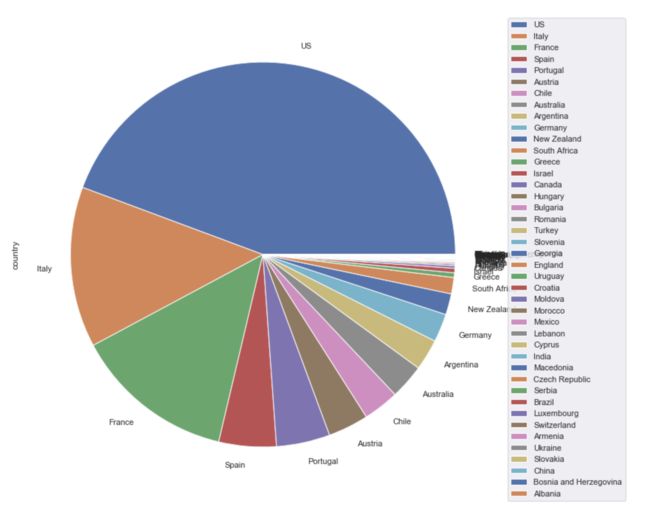
temp=wine.country.value_counts()
temp.plot(kind='pie',autopct='%.2f%%',figsize=(12,12))
plt.legend(bbox_to_anchor=(1,1))  #将图例设置在图片外
#图片尽力了,之后再研究可视化自定义的东西吧
- US、France、Italy、Spain都是葡萄酒大国,前四者的葡萄酒种类数量超过了总市场75%的份额。
temp=wine.groupby(['country','variety']).variety.count()
temp=temp.to_frame()
temp.columns=['quantity']
#组内排序(国家内部种类排序)
temp['rank_variety']=temp.quantity
temp['rank_variety']=temp.groupby(by='country').rank_variety.apply(lambda x:x.rank(method='min',ascending=False))
# 国家排序
temp1=temp.groupby(by=['country']).quantity.sum().rank(method='min',ascending=False).sort_values()
temp1=temp1.to_frame()
temp1.columns=['rank_country']
#联结两个表
temp2=pd.merge(temp,temp1,on='country',right_index=True)
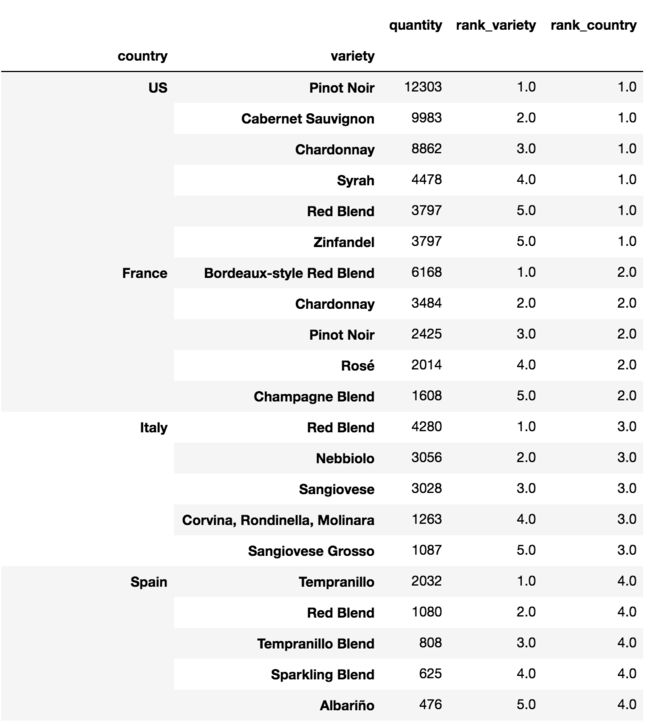
#返回每个国家前五的种类
temp3=temp2.sort_values(by=['rank_country','rank_variety'])
temp3[temp3.rank_variety<6]
- 提供一个表查询,可以返回每个国家数量最多的五类葡萄酒。
2、葡萄酒质量
2.1 总体质量情况
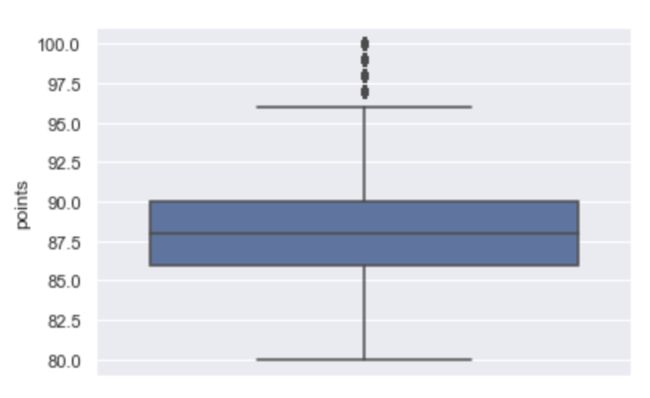
sns.set(style="darkgrid")
sns.boxplot(y='points',data=wine)
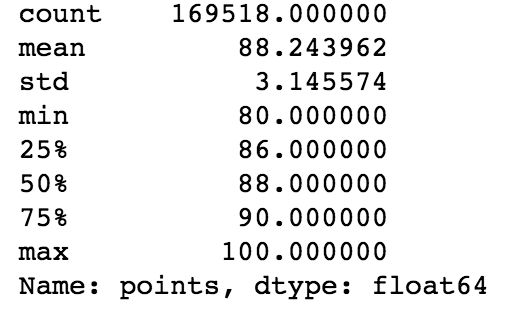
wine.points.describe()
- 葡萄酒平均得分为88.24分,可以认为:
优秀:90分及以上
良好:88.5~90分
一般:86~88.5分
较差:86分以下
2.2 不同国家的葡萄酒质量
#确定十五个国家
temp=wine.country.value_counts()[0:15]

#形成新表收藏十五个国家的数据
country_15=temp1=wine
for i in list(wine.index):
    if country_15=temp1.loc[i].country not in list(temp.index):
        country_15=temp1=country_15=temp1.drop(labels=i)

plt.figure(figsize=(12,12))
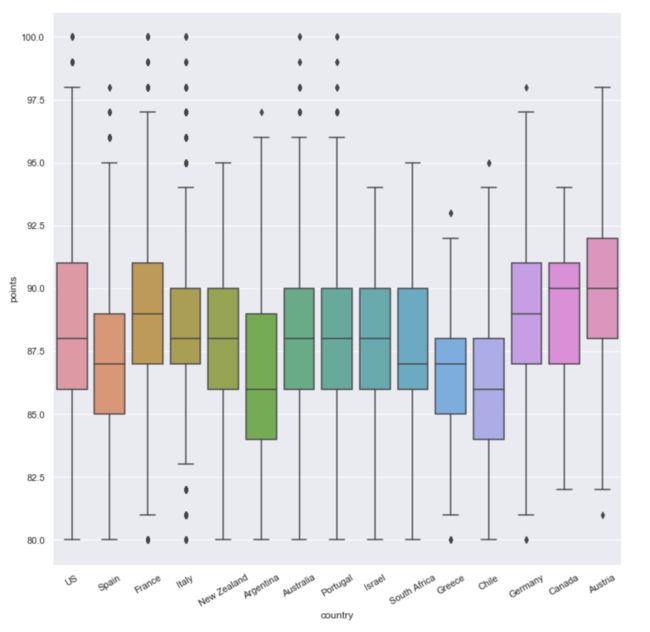
sns.boxplot(x='country',y='points',data=temp1)
plt.xticks(rotation=30)
#想在箱图中加一条平均值的直线,但是不知道怎么加!!
- Canada、Austria虽然不是不是葡萄酒的盛产国,但其平均分治较高,而且低分葡萄酒较少,表明这些国家的葡萄酒质量有一定的保障,但没有绝佳的葡萄酒产品;
- US、France作为葡萄酒大国,均分处在中等水平,同时存在绝佳的葡萄酒(满分产品)以及质量较差的葡萄酒(最低分产品),葡萄酒整体质量尚可,
- Spain作为葡萄酒第二大国,均分较低,也不存在绝佳的葡萄酒产品,整体质量有待提高。
#确定十五个国家
country_15=country_15.drop(labels='index',axis=1)
#转化成百分率
country_points_new=country_points
country_points_new.bad=country_points_new.bad.values/country_points_new.total.values
country_points_new.normal=country_points_new.normal.values/country_points_new.total.values
country_points_new.good=country_points_new.good.values/country_points_new.total.values
country_points_new.excellent=country_points_new.excellent.values/country_points_new.total.values
country_points_new=country_points_new.drop(label='total',axis=1)
#要画堆积图必须进行层级索引的转换
country_points_new.columns=pd.MultiIndex.from_product([['Ratio'],['bad','normal','good','excellent']])
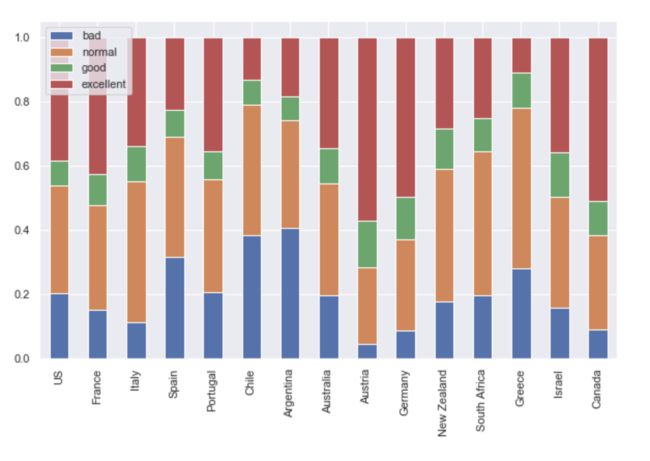
country_points_new.plot(y='Ratio',kind='bar',figsize=(10,6),stacked=True)
- Canada、Austria、Germany表现良好,Chile、Argentina
、Greece表现较差,这与前文中分析的结论是一致的; - 葡萄酒大国中US、France比较优秀,Spain表现有待提升,这与前文中分析的结论也是一致的。
3、葡萄酒价格
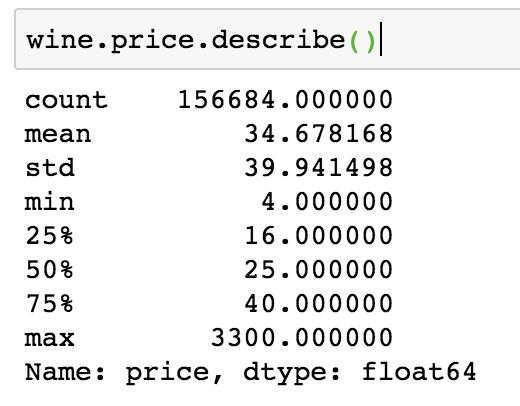
3.1 整体价格情况
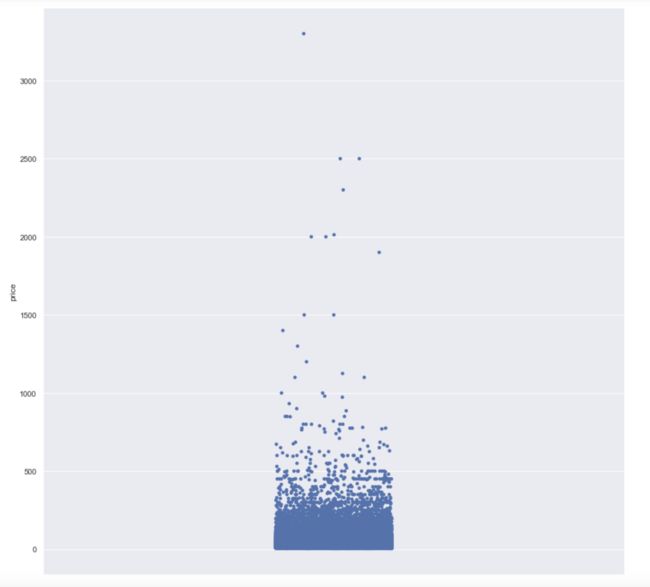
- 葡萄酒价格最大值为3300,属于极值情况
plt.figure(figsize=(15,15))
sns.stripplot(y='price',data=wine)
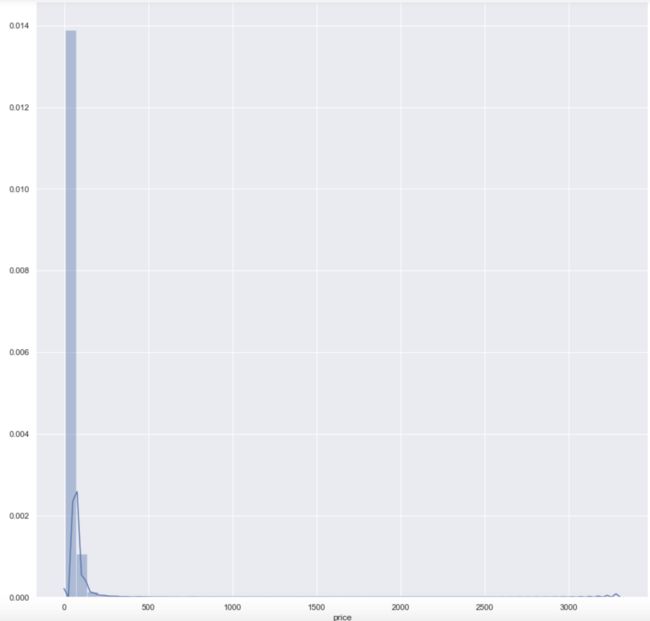
plt.figure(figsize=(15,15))
sns.distplot(wine.price.dropna())
根据葡萄酒的价格分布可知:
- 葡萄酒价格一般在0~100之间,超过500以上的可认为是高端酒类,超过1000以上则是顶级奢华酒类。
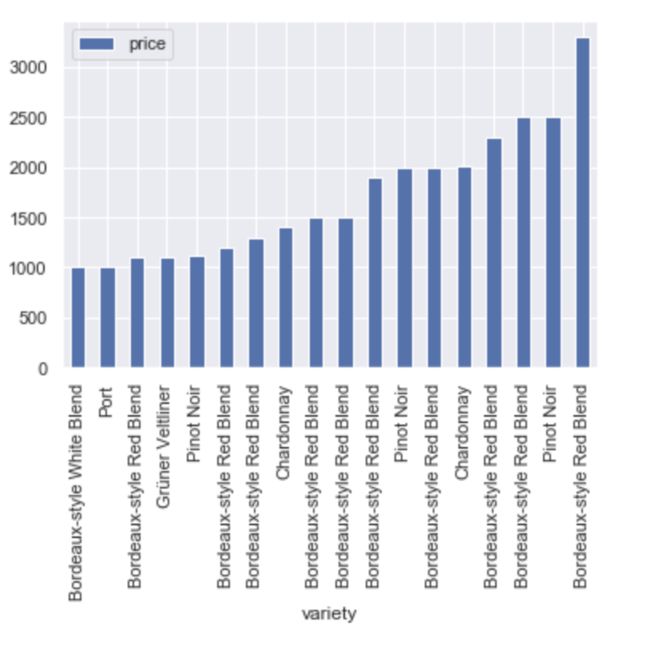
这些顶级奢华葡萄酒分别是:
high_price=wine[wine.price>=1000][['country','province','designation','points','variety','price']].sort_values(by='price')
high_price.plot(kind='bar',x='variety',y='price')
可以得到以下结论:
- 最顶级的葡萄酒种类为:Bordeaux-style Red Blend、Pinot Noir、Chardonnay、Grüner Veltliner、Port和Bordeaux-style White Blend;
- 法国Bordeaux盛产顶级葡萄酒,主要是以Bordeaux命名的两类葡萄酒:Bordeaux-style Red Blend、Bordeaux-style White Blend;
- 顶级葡萄酒的评分除一项外均在90分以上,证明其品质优秀,也说明了“贵的有道理”;
- 价格最高(3300)的葡萄酒评分反而低于90,一方面可能是其本身质量不够好,也有可能是因其定价远超出其质量导致了低分效应。
3.2 价格和评分的关系
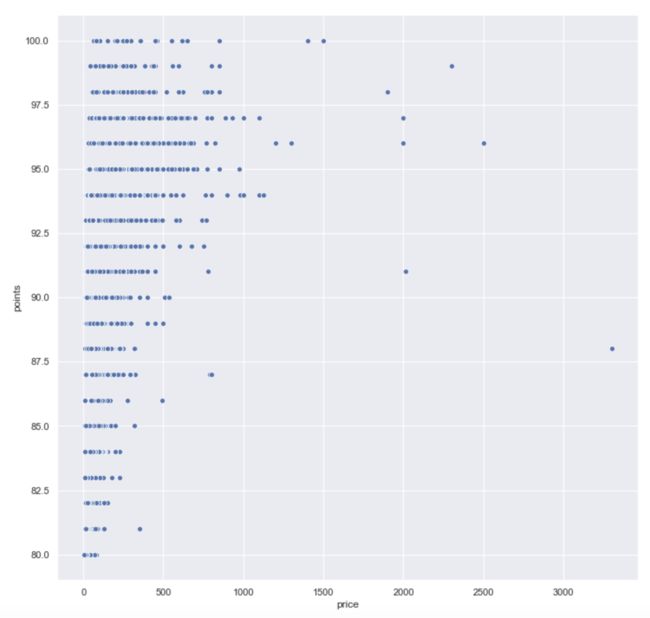
价格和评分的整体分布为:
plt.figure(figsize=(12,12))
sns.scatterplot(x='price',y='points',data=wine)
a=wine[['points','price']].corr()
print('价格和评分的整体相关性系数为%.4f'%(a[0:1]['price']))
b=wine[wine.price<100][['points','price']].corr()
print('单价为100以下的葡萄酒价格和评分的相关性系数为%.4f'%(b[0:1]['price']))
价格和评分的整体相关性系数为 0.4270
单价为100以下的葡萄酒价格和评分的相关性系数为 0.5501
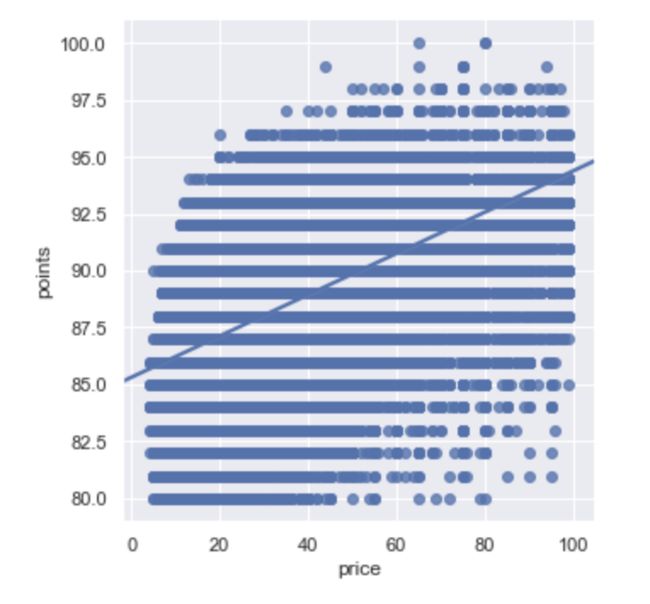
- 单价为100以下的葡萄酒价格和评分的相关性系数为 0.5501,可以认为价格和评分有一定的正相关关系;
- 单价在100以上后,价格和评分的相关性减弱,有可能是这些商品的定价因素有很多的其他附属价值,而不是单纯的葡萄酒质量。
利用单价100以下的数据建立回归模型:
plt.figure(figsize=(12,12))
sns.lmplot(x='price',y='points',data=(wine[wine.price<100][['points','price']]))
from sklearn import linear_model #导入机器学习库中的线性回归方法
x=np.array(wine[wine.price<100]['price']).reshape(151615,1)
y=np.array(wine[wine.price<100]['points']).reshape(151615,1)
#建立回归模型
model=linear_model.LinearRegression()
model.fit(x,y)
#获取模型
coef=model.coef_ #获取自变量系数
model_intercept=model.intercept_#获取截距
R2=model.score(x,y) #R的平方
print('线性回归方程为:','\n','y=’{}*x+{}'.format(coef,model_intercept))
线性回归方程为:
 y=’[[0.09049411]]*x+[85.31720477]
当葡萄酒的实际评分大于该模型反馈的评分时,可以认为该葡萄酒的性价比较高。从原始数据中筛选这部分模型(扩展到所有价格区间):
#生成新表来记录性价比高的葡萄酒
wine_good=wine
wine_good['points_new']=coef*wine_good.price+model_intercept
wine_good=wine[wine_good.points>wine_good.points_new].reset_index(drop=True)
#画图
wine_good.country.value_counts().plot(kind='pie',figsize=(12,12))
plt.legend(bbox_to_anchor=(1,1))  #将图例设置在图片外
与前文分析对比可知:
- US、France、Italy、Spain都是葡萄酒大国,US无论是葡萄酒数量还是高性价比葡萄酒数量都稳居榜首;
- France虽然葡萄酒数量占比比Italy更高,但是性价比方面却落后于Italy,这可能是因为France擅产顶级奢侈葡萄酒,而Italy把市场瞄准在中端市场。
wine_good.variety.value_counts()[0:15].plot(kind='bar',figsize=(12,12))
- 含有较多高性价比葡萄酒的种类有:Pinot Noir、Chardonnay、Red Blend 、Cabernet Sauvignon、Riesling等,而这几类本身也是市场占有率较高的几类;
- 同时含有顶级奢侈酒的种类有:Pinot Noir、Chardonnay、Bordeaux-style Red Blend。
3.3 高性价比葡萄酒推荐库
#确定每个价格段的评分最高的10个葡萄酒
temp=list(wine.groupby('price').points.nlargest(5).to_frame().reset_index().level_1)
#创建新表作为葡萄酒推荐库
wine_recommend=wine.loc[temp].reset_index(drop=True)

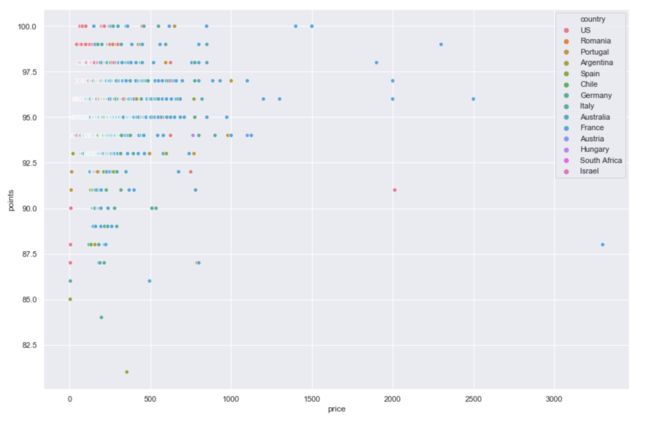
plt.figure(figsize=(15, 10))
sns.scatterplot(y='points',x='price',hue='country',data=wine_recommend)
创建葡萄酒推荐库,当用户输入预期价格时,会自动推荐性价比最高的葡萄酒(也可以创建库让用户可以输入国家或者种类等信息,这里没有拓展):
print('请输入您的葡萄酒预期价格:')
a=float(input(''))
# 如果价格正好有
if a in list(wine_recommend.price):
    temp=wine_recommend[wine_recommend.price==a]
    for i in list(temp.index):
      if temp.loc[i].designation:    #如果有葡萄酒名字
        print('为您推荐:来自%s的%s种类的%s葡萄酒,价格为%.1f,得分为%.1f。'%(temp.loc[i].country,temp.loc[i].variety,temp.loc[i].designation,temp.loc[i].price,temp.loc[i].points))
      else:
        print('为您推荐:来自%s的%s类葡萄酒,价格为%.1f,得分为%.1f。'%(temp.loc[i].country,temp.loc[i].variety,temp.loc[i].price,temp.loc[i].points))
#如果价格没有,则不推荐(其实这里也应该推荐价格低一些的,但是懒得写了!)
else:
    print('没有合适的价格,请重新输入')
请输入您的葡萄酒预期价格:
50
为您推荐:来自US的Bordeaux-style Red Blend种类的Red Wine葡萄酒,价格为50.0,得分为98.0。
为您推荐:来自US的Chardonnay种类的Allen Vineyard葡萄酒,价格为50.0,得分为97.0。
为您推荐:来自US的Pinot Noir种类的Sundawg Ridge Vineyard葡萄酒,价格为50.0,得分为97.0。
为您推荐:来自US的Chardonnay种类的Dutton Ranch Rued Vineyard葡萄酒,价格为50.0,得分为97.0。
为您推荐:来自US的Cabernet Sauvignon种类的Estate葡萄酒,价格为50.0,得分为97.0。
4、葡萄酒描述词库
4.1 整体关键词描述
from wordcloud import WordCloud
wc=WordCloud(background_color="white", max_words=200, colormap="Set2")

#略过了创建停用词库进行数据清洗的环节
words=wine.description
wc.generate(''.join(str(words)))
plt.figure(figsize=(10, 10))
plt.imshow(wc, interpolation='bilinear')
plt.axis("off")
plt.show()
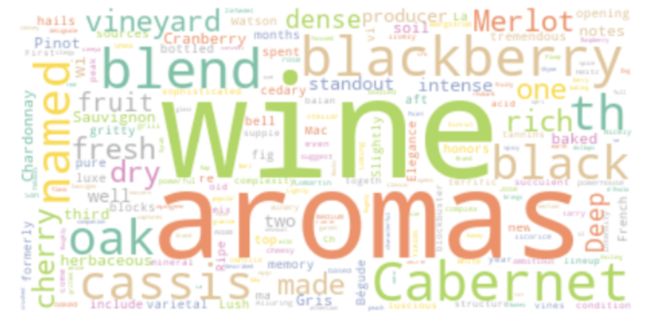
- 整体性的关键词描述:wine、aromas、Cabernet、blackberry、blend等;
4.2 创建不同种类葡萄酒的词频库
#只为拥有数量在100之上的种类创建词频库
temp=wine.variety.value_counts()
temp=temp[temp>100].to_frame().reset_index()
temp=temp.drop(labels='variety',axis=1)
temp.columns=['variety']

#用inner联结的方式创建新表
wine_words=pd.merge(wine,temp,on='variety')
temp1=wine_words.groupby(by='variety').description.apply(lambda x:''.join(str(x)))
#创建一个dataframe,列名为种类,值为种类的关键词(其实应该为每一个种类创建词频库,我只是在偷懒)
wine_keys=pd.DataFrame()
for variety_name in temp1.index:
    words=temp1[variety_name].lower().split()[1:]
    a=dict()
    for word in words:
        if word not in a:
            a[word] = 1
        else:
            a[word] = a[word] + 1
    #对字典键值(出现频次)排序,返回出现频次最高的30个关键词,并更新在词频库中
    a=pd.Series(a)
    a=a.sort_values(ascending=False)[0:30]
    wine_keys[variety_name]=list(a.index)
#词频库中存在大量的停用词,我没有处理的

#词频库的反馈规则为:1、如果某个词没有出现,则认为无法判断;
#                2、如果某个词在超过10个种类中出现,则认为无法判断;
#               3、如果某个词在小于10个种类中出现,则返回排名最高的那五个类;
#反馈规则也有很大问题,不再深究了

print('请输入一个关键词:')
keywords=input()

#创建一个字典(再转化成dataframe)记录所属关键词所属的种类,以及索引。如果种类数小于10,则返回索引最小的那几个种类
a=dict()
for variety_name in list(wine_keys.columns):
    if (wine_keys[variety_name]==keywords).sum()==1:
        a[variety_name]=(wine_keys[variety_name]==keywords).idxmax()
a=pd.Series(a)
if a.shape[0]>10:
    print('信息不足,无法判断')
else:
    b=a.sort_values()[0:5]
    print('根据您输入的信息,为您推荐相关的葡萄酒种类:')
    for aaa in list(b.index):
        print(aaa)
词频库的筛选结果如下:
请输入一个关键词:
in
信息不足,无法判断
请输入一个关键词:
sauvignon
根据您输入的信息,为您推荐相关的葡萄酒种类:
Cabernet Sauvignon-Syrah
Cabernet Blend
Fumé Blanc
Sauvignon
Sémillon
5、品鉴师信息
5.1 品鉴师总体情况
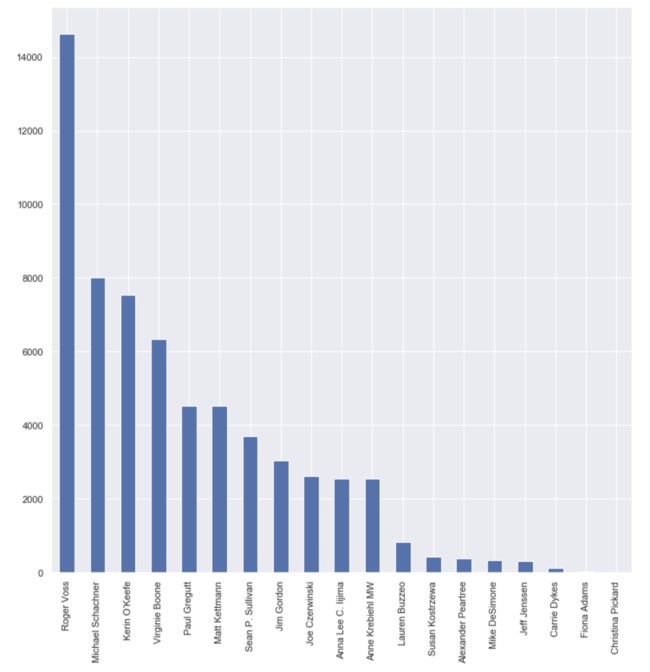
wine.taster_name.value_counts().plot(kind='bar',figsize=(12,12))
plt.xticks(rotation=90)
- 一共有19位品鉴师,其中Roger Voss、Michael Schachner、Kerin O’Keefe、Virginie Boone、Paul Gregutt等人是最资深的葡萄酒品鉴专家,并负责了市场上绝大部分的葡萄酒品鉴工作。
5.2 受到不同市场青睐的品鉴师
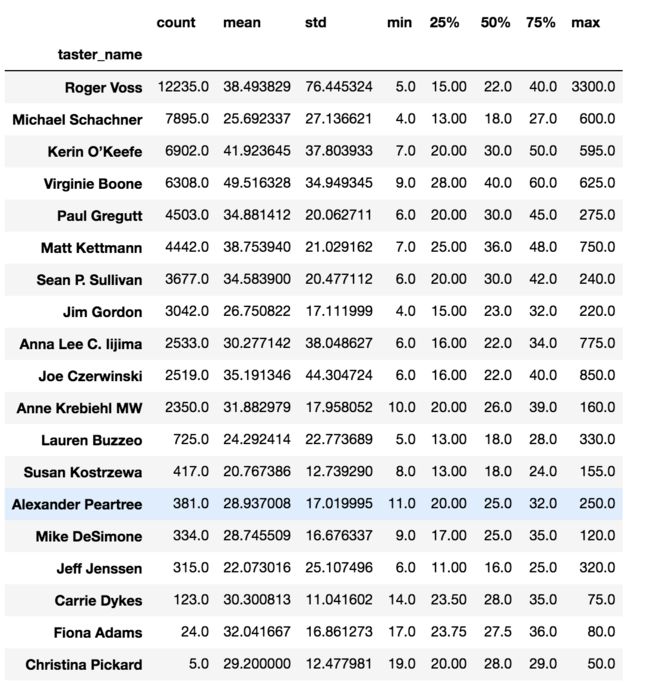
wine.groupby('taster_name').price.describe().sort_values(by='count',ascending=False)
plt.figure(figsize=(12,12))
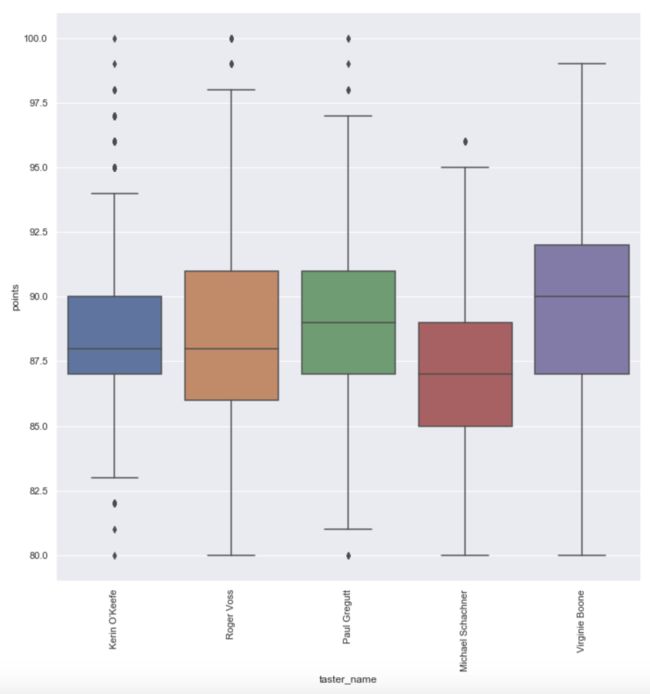
wine_taster=wine[(wine.taster_name=='Roger Voss')|(wine.taster_name=='Michael Schachner')|(wine.taster_name=='Kerin O’Keefe')|(wine.taster_name=='Virginie Boone')|(wine.taster_name=='Paul Gregutt')]
sns.boxplot(y='points',x='taster_name',data=wine_taster)
plt.xticks(rotation=90)
从表中数据可以看出:
- Roger Voss作为最资深的葡萄酒品鉴专家,品鉴种类相当广泛,涵盖低中高市场,同时拥有对最顶级奢华葡萄酒(价格为3300)的品鉴经验;
- Kerin O’Keefe和Virginie Boone则主要受到中高端葡萄酒商家的青睐,品鉴的葡萄酒均价为分别为41.9和49.5,评分也比较集中在一般和良好之间;
- Michael Schachner则主要瞄准中低端市场,品鉴的葡萄酒均价为25.69,相应的葡萄酒评分较低。
- Kerin O’Keefe和Virginie Boone同为中高端市场的品鉴专家,评分上面却存在较大差异,这可能是由于Kerin O’Keefe较为严苛所致,对此还可以进一步进行佐证的是:Paul Gregutt品鉴的葡萄酒价格整体较Kerin O’Keefe更低,但是整体评分却比Kerin O’Keefe的更高。
5.3 品鉴师品鉴种类及联系方式概览
#创建一个表,收集每个品鉴师品鉴最多的五个种类
temp=wine.groupby('taster_name').variety.value_counts().to_frame()
temp.columns=['num']
temp=temp.reset_index(level='variety')

taster_variety=pd.DataFrame()
for aaa in temp.index:
    taster_variety[aaa]=list(temp.loc[aaa].variety[0:5])
taster_variety=taster_variety.T
taster_variety=taster_variety.reset_index()
taster_variety.columns=[['taster_name','variety1','variety2','variety3','variety4','variety5']]

#创建一个表,收集品鉴师的联系方式,该表按照品鉴师资深程度排列
link=wine[['taster_name','taster_twitter_handle']].dropna().drop_duplicates()
namelist=list(wine.taster_name.value_counts().index)

name_link=pd.DataFrame(dict(zip(namelist,namelist)),index=['taster_twitter_handle'])
for aaa in namelist:
    if aaa in list(link.taster_name):
        name_link[aaa]=list(link[link.taster_name==aaa].taster_twitter_handle)[0]
    else:
        name_link[aaa]='@'
name_link=name_link.T.reset_index()
name_link.columns=[['taster_name','taster_twitter_handle']]

#联结两表
taster_info=pd.merge(name_link,taster_variety)
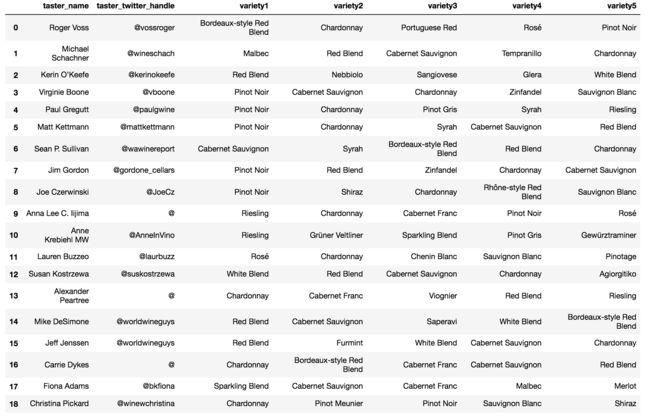
- 提供了一个品鉴师名录,按照资深程度排序,显示该品鉴师的联系方式,以及品鉴最多的五类葡萄酒。
6、总结
- US、France、Italy、Spain都是葡萄酒大国,US无论是葡萄酒数量还是高性价比葡萄酒数量都稳居榜首,France擅产顶级奢侈葡萄酒,Italy把市场瞄准在中端市场,Spain的整体质量有待提高;
- 数量最多的葡萄酒种类有Pinot Noir 、Chardonnay 、Cabernet Sauvignon等,其中最顶级的葡萄酒种类为:Bordeaux-style Red Blend、Pinot Noir、Chardonnay、Grüner Veltliner、Port和Bordeaux-style White Blend;
- 葡萄酒描述关键词有:wine、aromas、Cabernet、blackberry、blend等,同时创建了不同种类葡萄酒的词频库,用户输入关键词,可以反馈适合的葡萄酒种类;
- 葡萄酒品鉴师中,Roger Voss、Kerin O’Keefe、Virginie Boone和Michael Schachner都是资深的专家,面向的市场各有不同;同时创建了品鉴师名录,显示品鉴师联系方式,以及品鉴最多的五类葡萄酒。
