逻辑回归
在分类问题中,预测的结果是离散值(结果是否属于某一类),逻辑回归算法(Logistic Regression)被用于解决这类分类问题,如下:
- 垃圾邮件判断
- 金融欺诈判断
- 肿瘤诊断
该练习将以octave 作为工具进行实验,逻辑回归数学公式及讲解文档在这里,可点击访问。
绘图
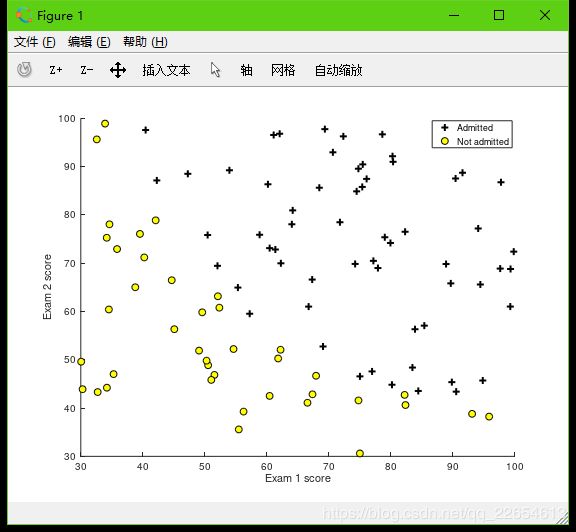
plotData.m 画出分类中正类与负类样本点
%% Function to plot 2D classification data

function plotData(X, y)

figure; hold on;

pos = find(y == 1); neg = find(y == 0);
plot(X(pos, 1), X(pos, 2), 'k+', 'LineWidth', 2, 'MarkerSize', 7);
plot(X(neg, 1), X(neg, 2), 'ko', 'MarkerFaceColor', 'y', 'MarkerSize', 7);
hold off;

endfunction
sigmoid函数
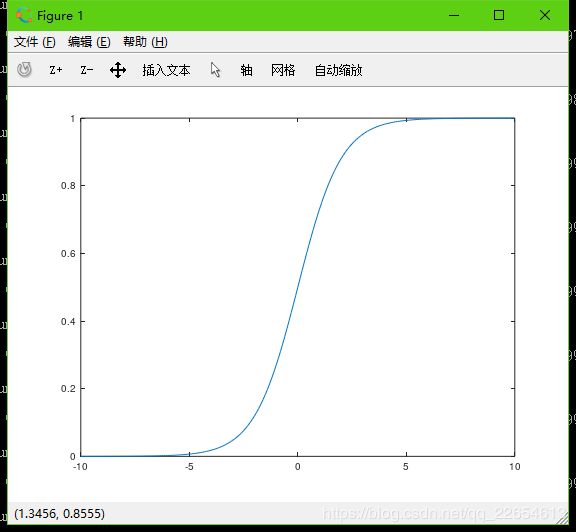
sigmoid.m 函数将所有实数映射到(0, 1)范围。
%% Sigmoid Function

function g = sigmoid (z)

g = zeros(size(z));
g = 1 ./ (1 + exp(-z));

endfunction
预测
predict.m 判断若g >= 0.5 则为正类1,反之为负类0:
%% Logistic Regression Prediction Function

function p = predict(X, theta)

m = size(X, 1);
p = zeros(m, 1);
g = sigmoid(X * theta);
k = find(g >= 0.5);
p(k) = 1;

endfunction
特征映射
mapFeature.m 用于生成多项式特征值,如将2个特征生成更多的特征:
%% Function to generate polynomial features
%% use X1, X2 and Returns a new feature array with more features, comprising of X1, X2, X1.^2, X2.^2, X1*X2, X1*X2.^2, etc..

function out = mapFeature (X1, X2)

degree = 6;
out = ones(size(X1(:,1)));
for i = 1:degree
    for j = 0:i
        out(:, end+1) = (X1.^(i-j)) .* (X2.^j);
    end
end

endfunction
代价函数(无正则化)
costFunction.m 计算代价函数及梯度下降偏导,不含正则项(罚项) ,可用于最优化函数 fminunc,以求解最优化问题(注意可以不用求了):
%% Logistic Regression Cost Function

function [J, gradient] = costFunction(X, y, theta)

m = length(y);
J = 0;
gradient = zeros(size(theta));
J = -1 * sum(y .* log(sigmoid(X * theta)) + (1 - y) .* log(1 - sigmoid(X * theta))) / m;

gradient = (X' * (sigmoid(X * theta) - y)) / m;

endfunction
代价函数(正则化)
costFunctionReg.m 计算代价函数及梯度下降偏导,含正则项(罚项),可用于最优化函数 fminunc,以求解最优化问题(注意可以不用求了):
%% Regularized Logistic Regression Cost

function [J, gradient] = costFunctionReg (X, y, theta, lambda)

m = length(y);
J = 0;
gradient = zeros(size(theta));
theta_1 = [0; theta(2:end)]; %theta(1) 不参与正则化,所以取零
J = -1 * sum(y .* log(sigmoid(X * theta)) + (1 - y) .* log(1 - sigmoid(X * theta))) / m + lambda/(2 * m) * theta_1' * theta_1;

gradient = (X' * (sigmoid(X * theta) - y)) / m + lambda / m * theta_1;

endfunction
应用正则化的正规方程法:
: 正则化项
: 第一行第一列为 的 维单位矩阵
决策边界绘制
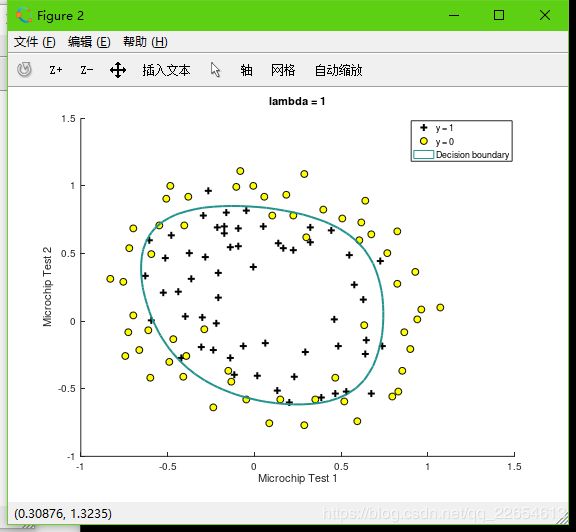
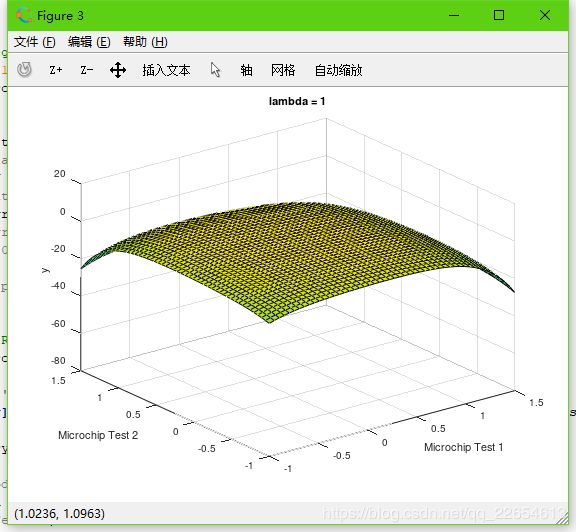
plotDecisionBoundary.m 画出分类边界,下面代码中if里面为逻辑回归模型中绘制线性拟合的决策边界, else里面为绘制多项式拟合的决策边界:
%% Function to plot classifier’s decision boundary

function plotDecisionBoundary(X, y, theta)

plotData(X(:, 2:3), y);
hold on;

if size(X, 2) <= 3
    plot_x = [min(X(:, 2)) - 2, max(X(:, 2)) + 2];
    plot_y = (theta(1) + theta(2) .* plot_x) * (-1 ./ theta(3));
    plot(plot_x, plot_y);
    legend('Admitted', 'Not admitted', 'Decision Boundary');
    axis([30, 100, 30, 100]);
else
    % Here is the grid range
    u = linspace(-1, 1.5, 50);
    v = linspace(-1, 1.5, 50);
    z = zeros(length(u), length(v));
    for i = 1:length(u)
        for j = 1:length(v)
            z(i,j) = mapFeature(u(i), v(j)) * theta;
        end
    end
    z = z';
    contour(u, v, z, [0,0], 'LineWidth', 2);
    hold on;
    title('lambda = 1')
    % Labels and Legend
    xlabel('Microchip Test 1')
    ylabel('Microchip Test 2')
    legend('y = 1', 'y = 0', 'Decision boundary')
    hold off
    pause;
    figure;
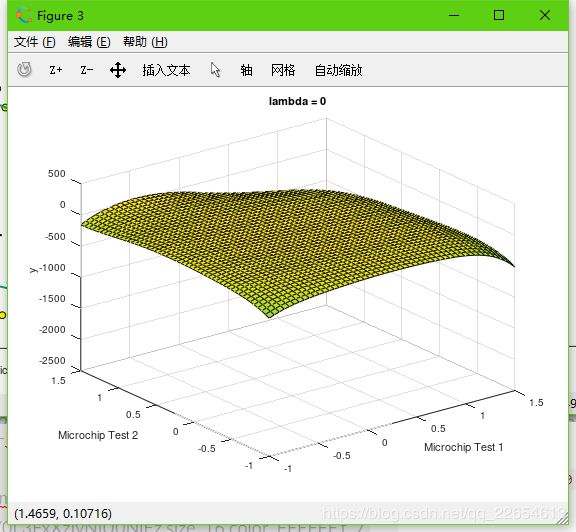
    surf(u, v, z);
    xlabel('u')
    ylabel('v')
    zlabel('z');
end

endfunction
线性拟合可视化(无正则化)
综合上述所有函数对数据进行可视化操作,以下为逻辑回归中线性拟合。
导入数据ex2data1.txt 点击此处可下载
- 绘制正负类样本点:
%% Machine Learning Online Class - Exercise 2: Logistic Regression

clear; close all; clc

%% ==================== 1.Plotting ====================
data = load('ex2data1.txt');
X = data(:, [1, 2]);
y = data(:, 3);

plotData(X, y)
xlabel('Exam 1 score')
ylabel('Exam 2 score')
legend('Admitted', 'Not admitted');
hold off;

fprintf('\nProgram paused. Press enter to continue.\n');
pause;
- 计算代价函数及梯度下降:
%% ============ 2.Compute Cost and Gradient ============
[m, n] =  size(X);
X = [ones(m, 1) X];
initial_theta = zeros(n + 1, 1);
[J, gradient] = costFunction(X, y, initial_theta);

fprintf('Cost at initial theta (zeros): %f\n', J);
fprintf('Expected J (approx): 0.693\n');
fprintf('Gradient at initial theta (zeros): \n');
fprintf(' %f \n', gradient);
fprintf('Expected gradients (approx):\n -0.1000\n -12.0092\n -11.2628\n');

[J, gradient] = costFunction(X, y, [-24; 0.2; 0.2]);

fprintf('\nCost at test theta: %f\n', J);
fprintf('Expected J (approx): 0.218\n');
fprintf('Gradient at test theta: \n');
fprintf(' %f \n', gradient);
fprintf('Expected gradients (approx):\n 0.043\n 2.566\n 2.647\n');

fprintf('\nProgram paused. Press enter to continue.\n');
pause;
- 使用最优化函数
fminunc,以求解最优化问题并得到最优化后的theta值:
%% ============ 3.Optimizing using fminunc ============
options = optimset('GradObj', 'on', 'MaxIter', 400);
[theta, J, exitFlag] = fminunc(@(t)costFunction(X, y, t), initial_theta, options);

% Print theta to screen
fprintf('exitFlag: %f\n', exitFlag);
fprintf('J at theta found by fminunc: %f\n', J);
fprintf('Expected J (approx): 0.203\n');
fprintf('theta: \n');
fprintf(' %f \n', theta);
fprintf('Expected theta (approx):\n');
fprintf(' -25.161\n 0.206\n 0.201\n');
- 画出决策边界
plotDecisionBoundary(X, y, theta);
hold on;
xlabel('Exam 1 score')
ylabel('Exam 2 score')
legend('Admitted', 'Not admitted')
hold off;

fprintf('\nProgram paused. Press enter to continue.\n');
pause;
- 输入特征进行预测及计算训练集准确率
%% ============ 4.Predict and Accuracies ============

prob = sigmoid([1 45 85] * theta);
fprintf(['For a student with scores 45 and 85, we predict an admission probability of %f\n'], prob);
fprintf('Expected value: 0.775 +/- 0.002\n\n');

p = predict(X, theta);
fprintf('p: %d\n', p);
fprintf('Train Accuracy: %f\n', mean(double(p == y)) * 100);
fprintf('Expected accuracy (approx): 89.0\n');
fprintf('\n')
多项式拟合可视化(正则化)
用到数据ex2data2.txt 点击此处可下载
- 绘制正负类样本点:
%% Octave/MATLAB script for the later parts of the exercise
%% Machine Learning Online Class - Exercise 2: Logistic Regression

clear; close all; clc;

data = load('ex2data2.txt');
X = data(:, [1, 2]);
y = data(:, 3);

plotData(X, y);

hold on;
xlabel('Microchip Test 1');
ylabel('Microchip Test 2');

legend('y = 1', 'y = 0');
hold off;
- 计算正则化后代价函数及梯度下降:
%% =========== 1.Regularized Logistic Regression ============

X = mapFeature(X(:,1), X(:,2));
initail_theta = zeros(size(X, 2), 1);

lambda = 1;
[J, gradient] = costFunctionReg(X, y, initail_theta, lambda);
fprintf('J at initial theta (zeros): %f\n', J);
fprintf('Expected J (approx): 0.693\n');
fprintf('Gradient at initial theta (zeros) - first five values only:\n');
fprintf(' %f \n', gradient(1:5));
fprintf('Expected gradients (approx) - first five values only:\n');
fprintf(' 0.0085\n 0.0188\n 0.0001\n 0.0503\n 0.0115\n');

fprintf('\nProgram paused. Press enter to continue.\n');
pause;
- 绘制决策边界
%% ============= 2.Regularization and Accuracies =============
initial_theta = zeros(size(X, 2), 1);
lambda = 1;
options = optimset('GradObj', 'on', 'MaxIter', 400);
[theta, J, exitFlag] = fminunc(@(t)costFunctionReg(X, y, t, lambda), initial_theta, options);

plotDecisionBoundary(X, y, theta);
hold on;
title(sprintf('lambda = %g', lambda))
% Labels and Legend
xlabel('Microchip Test 1')
ylabel('Microchip Test 2')

legend('y = 1', 'y = 0', 'Decision boundary')
hold off;

p = predict(X, theta);
fprintf('Accuracy: %f\n', mean(double(p == y)) * 100);
fprintf('Expected accuracy (with lambda = 1): 83.1 (approx)\n');
- 正则参数
lambda = 1时,训练集准确率accuracy = 83.1%
- 正则参数
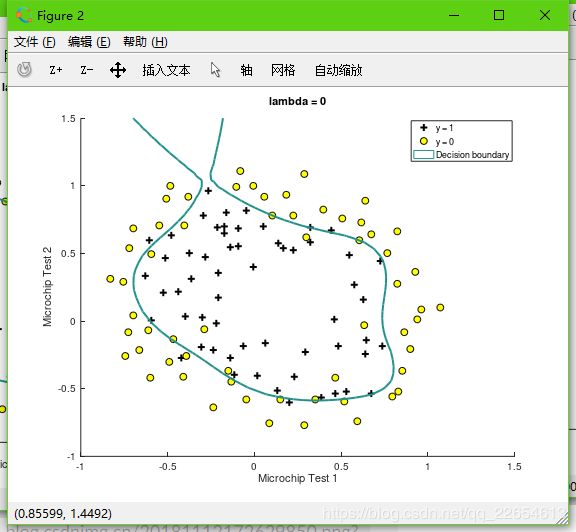
lambda = 0时,等于没有罚项,无法避免过拟合,训练集准确率accuracy = 86.4%
- 正则参数
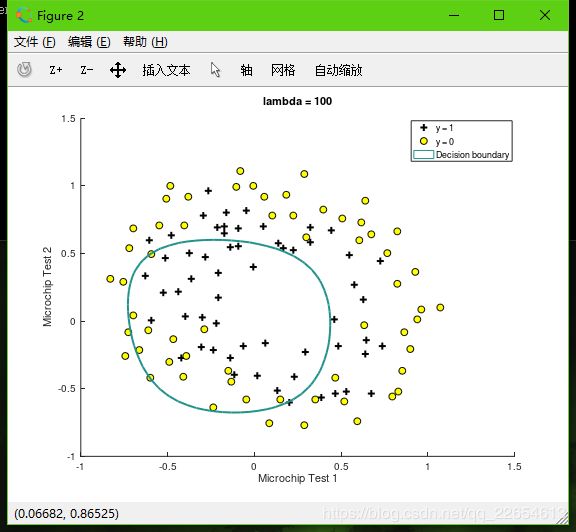
lambda = 100时,过大,导致模型欠拟合,训练集准确率accuracy = 60%
