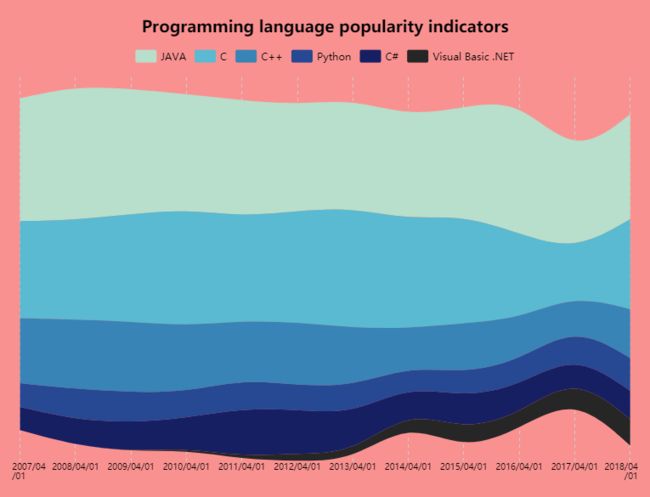
Popularity's indicator of programming languages
TheInternet & New Media 1502 -Zhong Chenyuan
The popularity index of the C++ programming language as the mouse passes by
Hello everyone, this is a visual picture I made.This is not only a job, it also refreshes my knowledge of the development ofprogramming languages. In addition, it also allows more people to recognizewhich programming languages are now more important to many companies.
This River Map I made isan indicator of the popularity of programming languages during 12 years. Theratings are based on the number of skilled engineers world-wide, courses andthird party vendors. Popular search engines such as Google, Bing, Yahoo!,Wikipedia, Amazon, YouTube and Baidu are used to calculate the ratings. It isimportant to note that the TIOBE index is not about the best programminglanguage or the language in which most lines of code have written.
I: How did I explore it?
First of all, I opened the programming languagepopularity index ranking of the TIOBE website, opened the latest June data,selected the first six programming languages, and read and recorded thedevelopment of their popularity over the past twelve years.
How did I read? I clicked on the data for theprevious six programming languages over the past 12 years and thenright-clicked on the page source code.
This is the page source code page I said. I said that I have chosen a total of six programming languages, so I need to open it six times in total. Each time I need to read the index for the past 12 years, I chose April of each year. This source code page comes from a table that Iclicked into a programming language for more than a decade, not a page rankingfor all programming languages.
Then I did an Excel spreadsheet based on thedifferent indices of each programming language over the past 12 years.
And then I use https://dydata.io/# to creative the visualized picture.
II: What important information do I want to convey?
Programming languages do not exist independently,and they are all likely to be affected by another programming language becausethey are all "languages" and they must have commonalities.
This image not only allows us to see Visual Basic.net coming from behind, but also allows us to recognize the potential of different programming languages. Visual Basic.NET is an object-oriented programming language based on the Microsoft .NET Framework. Its debugging is operated in an interpreted language, and the output is an EXE program that operates in a compiled language. For different groups of people,there are also different meanings of expression.
1. For those programmers who are learning to program, this interactive diagram is a good representation of the relationships and influence between different programming languages. This may provide some reference and help for them to learn other programming languages in the future.If someone wants to learn a more popular programming language, he can refer to this picture.
2.For those who do not know how toprogram, this interactive chart allows you to quickly understand the status andrelationships of various programming languages.
III: What did Ilearn from the visualized course and the visual data above?
The purpose of making this network is to make the programming language information more visual. Of course, only better and more complete information can lead to a more accurate information map. Now I think that traditional statistical charts are difficult to visualize complex data. In recent years, data visualization has become more and more popular as a new research area. Successful visualization, if done beautifully, is simple in appearance but rich in meaning, allowing observers to gain insights and new understandings at a glance. I have had the privilege of coming into contact with such a special course that can increase the efficiency of others' access to information and feel the feeling of data management.
Finally, I would also like to say that theVisualization Course has made me feel that programming is not a boring thing.It is flexible, it can be displayed, and it can be read by many people even ifthey do not program. It is like a bridge connecting data and reality. I amproud of this discipline.
At the same time, I am also proud of such aresponsible teacher.


