没有找到相应的x与y轴单位的设置方法
- 将生成好的html文件放入到 assets目录下,记得导入相应的js库,因为Echart的实现是有js实现的。可以去官网去下载相应的js库
- 使用WebView加载我们生成的网页
- 具体的操作方法如下
        WebSettings webSettings = wvHdZxchart.getSettings();
        webSettings.setAllowFileAccess(true);
        webSettings.setSupportZoom(true);
//      webSettings.setCacheMode(WebSettings.LOAD_NO_CACHE);
        // 开启脚本支持
        webSettings.setJavaScriptEnabled(true);
        wvHdZxchart.setBackgroundColor(0);

        wvHdZxchart.loadUrl("file:///android_asset/echart/zx_line.html");

        wvHdZxchart.setWebViewClient(new WebViewClient(){
            @Override
            public void onPageFinished(WebView view, String url) {
                view.loadUrl("javascript:createMpieChart();");
            }
        });
这样,在Android客户端就可以轻松实现各种PC图表,也可以通过js对象,动态的切换图表中相应的数据源。
折线图
var option = {
            title:{
                text:'ECharts 数据统计'
            },
            tooltip:{},
            legend:{
                data:['用户来源']
            },

            xAxis:{
                data:["0","1","2","3","4","5","6","7","8","9","10","11","12","13","14","15","16","17","18","19","20","21","22","23"]
            },
            yAxis:{
            type: 'value',
            name: '℃',
            nameLocation: 'end',
            nameGap: 10,
                nameTextStyle: {
                    color: '#fff',
                    fontSize: 16
                }
            },
            series:[{
                name:'访问量',
                type:'line',
                data:[30,5,36,10,30,5,36,10,5,36,10,30,50,50,36,10,30,50,50,30,10,30,50,50]
            }]
        };
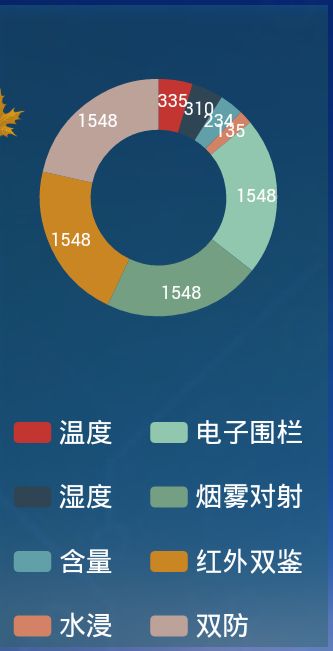
环形的饼状图
show:false : 鼠标悬浮上面不显示相应的数值信息
silent:true : 打开鼠标点击实事件,如果是空实现,没有任何效果(反之屏蔽掉所有的相应的鼠标滑过的事件,或者放大的效果等)
hoverAnimation:false :鼠标悬浮放大的效果展示
option = {
                tooltip: {
                    trigger: 'item',
                    show:false,
                    formatter: "{a}
{b}: {c} ({d}%)"
                },


                    legend: {
                orient: 'vertical',
                selectedMode:true,
                x: 'left',
        data:['红外测温','Gis超声波','Gis特高频','开关柜超声波','开关柜暂态地电压']
         },

                series: [
                    {
                        name:'访问来源',
                        type:'pie',
                        hoverAnimation:false,
                        radius: ['40%', '70%'],
                        center: ['50%', '30%'],
                        top:40,
                        avoidLabelOverlap: false,
                        selectedMode:false,
                        silent:true,
                        label: {
                           selectedMode:false,
                            normal: {
                                 show: true,
                                 position: 'inner',
                                 formatter: "{c}"
                            },
                            emphasis: {
                                show: false,
                                textStyle: {
                                    fontSize: '30',
                                    fontWeight: 'bold'
                                }
                            }
                        },
                        labelLine: {
                            normal: {
                                show: true
                            }
                        },
                        data:[
                            {value:335, name:'红外测温',textStyle:{color:'#ff00ff'}},
                            {value:310, name:'Gis超声波',textStyle:{color:"#000000"}},
                            {value:234, name:'Gis特高频',textStyle:{color:"#000000"}},
                            {value:135, name:'开关柜超声波',textStyle:{color:"#000000"}},
                            {value:1548, name:'开关柜暂态地电压',textStyle:{color:"#000000"}}
                        ]
                    }
                ],legend: {
                    orient: 'vertical',
                    y: 'bottom',
                    itemGap:20,
                    size:'50',
                    textStyle:{color:"#ffffff", fontSize: '18'},
                    data:[ '红外测温','Gis超声波','Gis特高频','开关柜超声波','开关柜暂态地电压']
                }, label: {
                     normal: {
                     textStyle: {
                     color: '#ffffff'
                    }
                }
                 },
                 labelLine: {
                     normal: {
                         lineStyle: {
                        color: 'rgba(255, 255, 255, 0.3)'
                    },
                    smooth: 0.2,
                    length: 10,
                    length2: 20
                }
            },
            };

