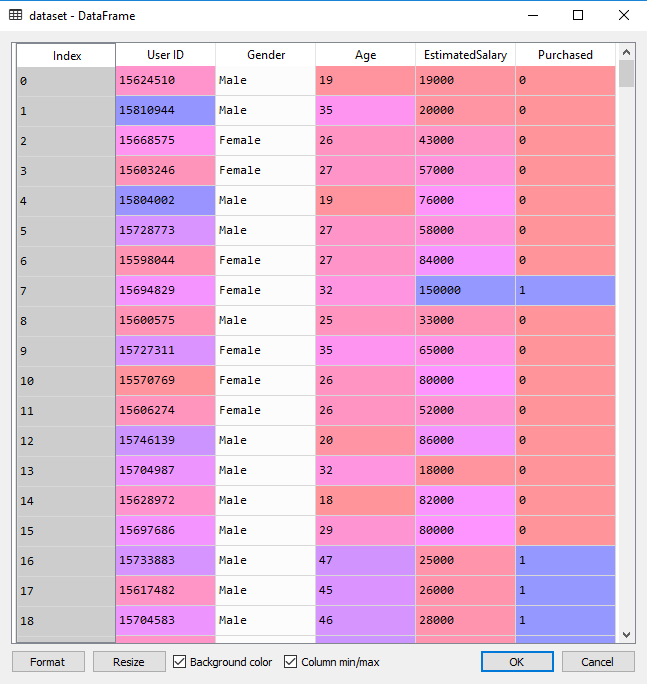
数据下载
一、数据预处理
- 导入库
import numpy as np
import pandas as pd
import matplotlib.pyplot as plt
%matplotlib inline
- 导入数据
df = pd.read_csv('D:\\data\\Social_Network_Ads.csv')
X = df.iloc[:,2:4]
Y = df.iloc[:,-1]
- 分割数据集
from sklearn.cross_validation import train_test_split
X_train, X_test, Y_train, Y_test = train_test_split(X, Y, test_size = 0.25)
- 数据标准化
from sklearn.preprocessing import StandardScaler
ss = StandardScaler()
ss = ss.fit(X_train)
X_train = ss.transform(X_train)
X_test = ss.transform(X_test)
二、使用SVM(linear kernel)模型
- 训练模型
from sklearn.svm import SVC
clf = SVC(kernel = 'linear', random_state = 0)
clf.fit(X_train, Y_train)
- 预测结果
Y_pred = clf.predict(X_test)
- 效果评估
- 混淆矩阵
from sklearn.metrics import confusion_matrix
cm = confusion_matrix(Y_test, Y_pred)
cm = array([[62, 5],[11, 22]], dtype=int64)
- 可视化
from matplotlib.colors import ListedColormap
X_set, y_set = X_train, Y_train
X1, X2 = np.meshgrid(np.arange(start = X_set[:, 0].min() - 1, stop = X_set[:, 0].max() + 1, step = 0.01),
                     np.arange(start = X_set[:, 1].min() - 1, stop = X_set[:, 1].max() + 1, step = 0.01))
plt.contourf(X1, X2, clf.predict(np.array([X1.ravel(), X2.ravel()]).T).reshape(X1.shape),
             alpha = 0.5, cmap = ListedColormap(('red', 'green')))
plt.xlim(X1.min(), X1.max())
plt.ylim(X2.min(), X2.max())
for i, j in enumerate(np.unique(y_set)):
    plt.scatter(X_set[y_set == j, 0], X_set[y_set == j, 1],
                c = ListedColormap(('red', 'green'))(i), label = j)
plt.title('SVM (Training set)')
plt.xlabel('Age')
plt.ylabel('Estimated Salary')
plt.legend()
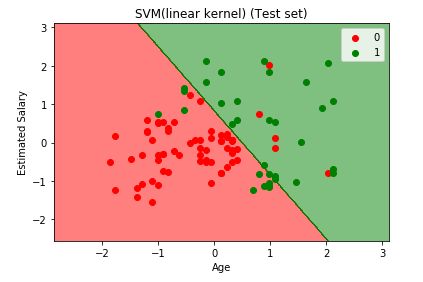
from matplotlib.colors import ListedColormap
X_set, y_set = X_test, Y_test
X1, X2 = np.meshgrid(np.arange(start = X_set[:, 0].min() - 1, stop = X_set[:, 0].max() + 1, step = 0.01),
                     np.arange(start = X_set[:, 1].min() - 1, stop = X_set[:, 1].max() + 1, step = 0.01))
plt.contourf(X1, X2, clf.predict(np.array([X1.ravel(), X2.ravel()]).T).reshape(X1.shape),
             alpha = 0.5, cmap = ListedColormap(('red', 'green')))
plt.xlim(X1.min(), X1.max())
plt.ylim(X2.min(), X2.max())
for i, j in enumerate(np.unique(y_set)):
    plt.scatter(X_set[y_set == j, 0], X_set[y_set == j, 1],
                c = ListedColormap(('red', 'green'))(i), label = j)
plt.title('SVM(linear kernel) (Test set)')
plt.xlabel('Age')
plt.ylabel('Estimated Salary')
plt.legend()
三、使用SVM(Gaussian kernel)模型
- 训练模型
clf = SVC(kernel = 'rbf')
clf.fit(X_train, Y_train)
- 预测结果
Y_pred = clf.predict(X_test)
- 效果评估
- 混淆矩阵
cm = confusion_matrix(Y_test, Y_pred)
cm = array([array([[64, 3], [ 4, 29]], dtype=int64)
- 可视化
from matplotlib.colors import ListedColormap
X_set, y_set = X_train, Y_train
X1, X2 = np.meshgrid(np.arange(start = X_set[:, 0].min() - 1, stop = X_set[:, 0].max() + 1, step = 0.01),
                     np.arange(start = X_set[:, 1].min() - 1, stop = X_set[:, 1].max() + 1, step = 0.01))
plt.contourf(X1, X2, clf.predict(np.array([X1.ravel(), X2.ravel()]).T).reshape(X1.shape),
             alpha = 0.5, cmap = ListedColormap(('red', 'green')))
plt.xlim(X1.min(), X1.max())
plt.ylim(X2.min(), X2.max())
for i, j in enumerate(np.unique(y_set)):
    plt.scatter(X_set[y_set == j, 0], X_set[y_set == j, 1],
                c = ListedColormap(('red', 'green'))(i), label = j)
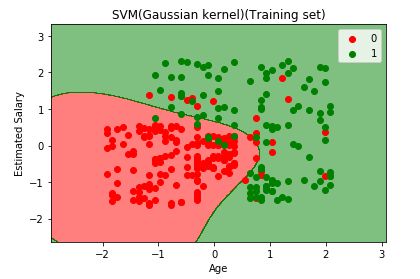
plt.title('SVM(Gaussian kernel)(Training set)')
plt.xlabel('Age')
plt.ylabel('Estimated Salary')
plt.legend()
from matplotlib.colors import ListedColormap
X_set, y_set = X_test, Y_test
X1, X2 = np.meshgrid(np.arange(start = X_set[:, 0].min() - 1, stop = X_set[:, 0].max() + 1, step = 0.01),
                     np.arange(start = X_set[:, 1].min() - 1, stop = X_set[:, 1].max() + 1, step = 0.01))
plt.contourf(X1, X2, clf.predict(np.array([X1.ravel(), X2.ravel()]).T).reshape(X1.shape),
             alpha = 0.5, cmap = ListedColormap(('red', 'green')))
plt.xlim(X1.min(), X1.max())
plt.ylim(X2.min(), X2.max())
for i, j in enumerate(np.unique(y_set)):
    plt.scatter(X_set[y_set == j, 0], X_set[y_set == j, 1],
                c = ListedColormap(('red', 'green'))(i), label = j)
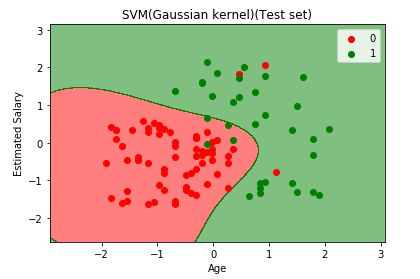
plt.title('SVM(Gaussian kernel)(Test set)')
plt.xlabel('Age')
plt.ylabel('Estimated Salary')
plt.legend()


