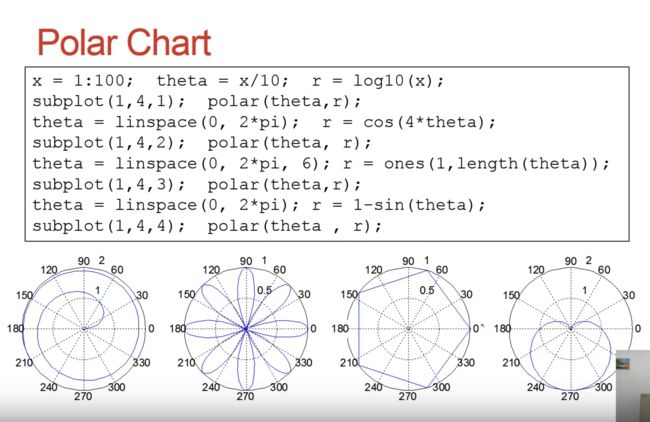
Polar Chart(极坐标图):
例:蜗牛线(蚌线、蚶线)
theta = linspace(0, 2*pi);

r = 1 + 2*cos(theta);
subplot(2,2,1);
line1 = polar(theta, r);
set(line1,  'LineWidth', 0.8,  'Color','m');
title('r = a + b cos\theta(a < b 时)(左右型)');

r = 2 + cos(theta);
subplot(2,2,3);
line2 = polar(theta, r);
set(line2,  'LineWidth', 0.8,  'Color','m');
title('r = a + b cos\theta(a > b 时)(左右型)');

r = 1 + 2*sin(theta);
subplot(2,2,2);
line3 = polar(theta, r);
set(line3,  'LineWidth', 0.8,  'Color','m');
title('r = a + b sin\theta(a < b 时)(上下型)');

r = 2 + sin(theta);
subplot(2,2,4);
line4 = polar(theta, r);
set(line4,  'LineWidth', 0.8,  'Color','m');
title('r = a + b sin\theta(a > b 时)(上下型)');
例:心脏线
theta = linspace(0, 2*pi);

r = 1 + sin(theta);
subplot(2,2,1);
line1 = polar(theta, r);
set(line1,  'LineWidth', 0.8,  'Color','r');
title('r = a + a sin\theta(上型)');

r = 1 - sin(theta);
subplot(2,2,2);
line2 = polar(theta, r);
set(line2,  'LineWidth', 0.8,  'Color','r');
title('r = a - a sin\theta(下型)');


r = 1 + cos(theta);
subplot(2,2,3);
line3 = polar(theta, r);
set(line3,  'LineWidth', 0.8,  'Color','r');
title('r = a + a cos\theta(右型)');

r = 1 - cos(theta);
subplot(2,2,4);
line4 = polar(theta, r);
set(line4,  'LineWidth', 0.8,  'Color','r');
title('r = a - a cos\theta(左型)');
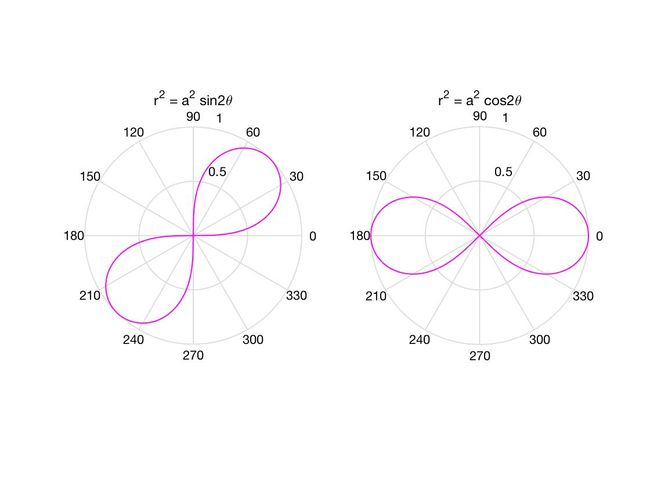
例:伯努利双纽线
theta = 0 : pi/200 : 2*pi;

r = sqrt( 1^2 * sin(2*theta) );
subplot(1,2,1);
line1 = polar(theta, r);
set(line1,  'LineWidth', 1,  'Color','m');
title('r^2 = a^2 sin2\theta');

r = sqrt( 1^2 * cos(2*theta) );
subplot(1,2,2);
line2 = polar(theta, r);
set(line2,  'LineWidth', 1,  'Color','m');
title('r^2 = a^2 cos2\theta');
例:阿基米德螺线
theta = 0 : pi/200 : 16*pi;
r = theta;
line = polar(theta, r);
set(line,  'LineWidth', 2,  'Color','m');
t = title('r = \theta');
set(t, 'FontSize',18);
例:对数螺线
theta = 0 : pi/500 : 50*pi;
r = 0.0000000000001 * exp(0.2*theta);
line = polar(theta, r);
set(line,  'LineWidth', 2,  'Color','b');
t = title('r = a e^{b\theta}');
set(t, 'FontSize',18);
例:双曲螺线
theta = 0 : 0.2 : 6*pi;
r = 3./(theta);
line = polar(theta, r);
set(line,  'LineWidth', 1,  'Color','b');
t = title('r = a/\theta');
set(t, 'FontSize',18);
例:费马螺线
theta = 0 : 0.01 : 4*pi;
a = 4;
r1 = a * sqrt(theta);
r2 = -a  * sqrt(theta);

line1 = polar(theta, r1, '-r');
hold on
line2 = polar(theta, r2, '-b');

set(line1, 'LineWidth', 2);
set(line2, 'LineWidth', 2);
legend('r = a \theta^{1/2}', 'r = -a \theta^{1/2}');
例:玫瑰线
theta = linspace(0, 2*pi);
a = 2;

r = a * sin(2*theta);
subplot(2,2,1);
line1 = polar(theta, r);
set(line1,  'LineWidth', 1,  'Color','r');
t = title('r = a sin(2\theta)  四瓣玫瑰');
set(t, 'FontSize',16);

r = a * sin(4*theta);
subplot(2,2,2);
line2 = polar(theta, r);
set(line2,  'LineWidth', 1,  'Color','r');
t = title('r = a sin(4\theta)  八瓣玫瑰');
set(t, 'FontSize',16);

r = a * sin(3*theta);
subplot(2,2,3);
line3 = polar(theta, r);
set(line3,  'LineWidth', 1,  'Color','b');
t = title('r = a sin(3\theta)  三瓣玫瑰');
set(t, 'FontSize',16);

r = a * sin(5*theta);
subplot(2,2,4);
line4 = polar(theta, r);
set(line4,  'LineWidth', 1,  'Color','b');
t = title('r = a sin(5\theta)  五瓣玫瑰');
set(t, 'FontSize',16);
三度空间曲面
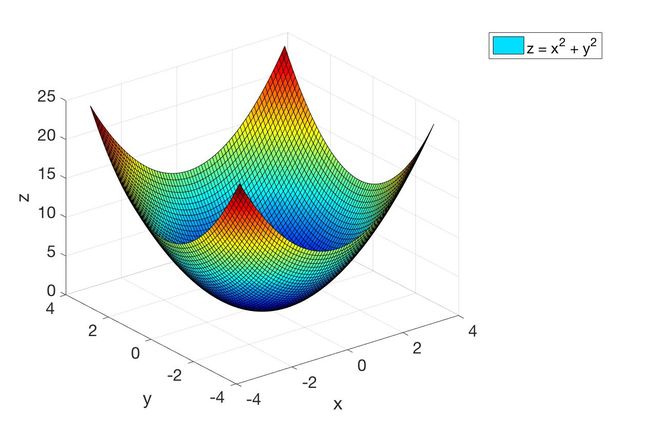
例:抛物线锅
x = -3.5 : 0.1 : 3.5;  y = -3.5 : 0.1 : 3.5;
[X,Y] = meshgrid(x,y);
Z = X.^2 + Y.^2;
surf(X,Y,Z);

set(gca,'FontSize', 16);
zlabel('z');
xlim([-4 4]); xlabel('x');
ylim([-4 4]); ylabel('y');
colormap(jet);
legend('z = x^2 + y^2');
axis normal;
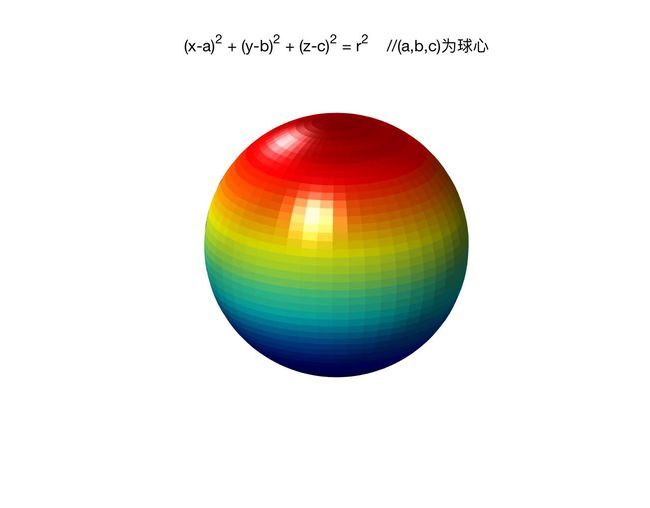
例:球(Sphere)
sphere(50);

axis equal tight;
colormap(jet);
shading flat;
axis vis3d off;
light('Position',[1 3 2]);
light('Position',[-3 -1 3]);
material shiny;
view(-45,20);
t1 = title('(x-a)^2 + (y-b)^2 + (z-c)^2 = r^2  //(a,b,c)为球心');
set(t1, 'FontSize',16);
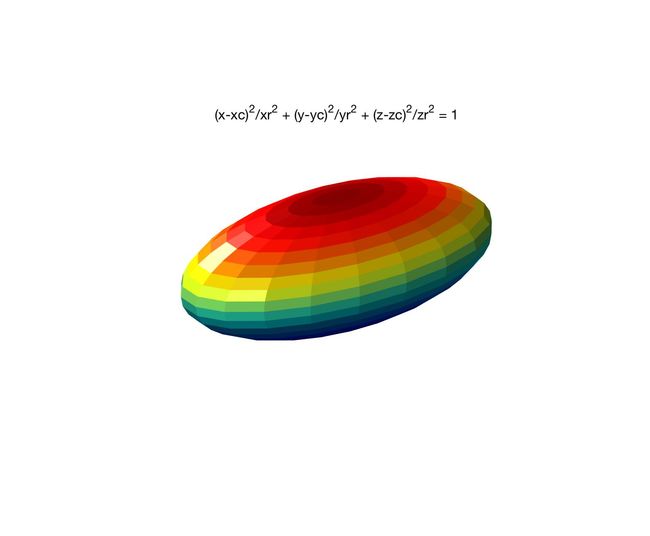
例:椭球(Ellipsoid)
xc = 0; yc = 0; zc = 0;   xr = 6; yr = 3; zr = 2;
[x,y,z] = ellipsoid(xc,yc,zc,xr,yr,zr);
surf(x, y, z)

axis equal tight;
colormap(jet);
shading flat;
axis vis3d off;
light('Position',[1 3 2]);
light('Position',[-3 -1 3]);
material shiny;
set(gcf,'Color',[1 1 1]);
view(-45,20);
t1 = title('(x-xc)^2/xr^2 + (y-yc)^2/yr^2 + (z-zc)^2/zr^2 = 1');
set(t1, 'FontSize',16);
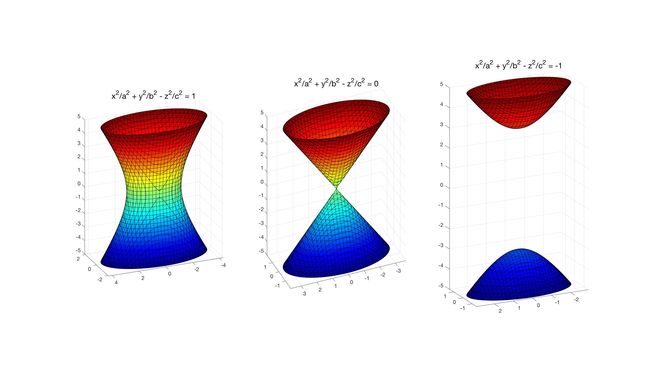
例:椭圆双曲面(Elliptic Hyperboloid)
syms x y z;
a = 1; b = 2; c = 3;

subplot(1,3,1);
fimplicit3(x^2./a^2 + y^2./b^2 - z^2./c^2 - 1);
axis equal;
colormap(jet);
t1 = title('x^2/a^2 + y^2/b^2 - z^2/c^2 = 1');
set(t1, 'FontSize',16);

subplot(1,3,2);
fimplicit3(x^2./a^2 + y^2./b^2 - z^2./c^2);
axis equal;
colormap(jet);
t2 = title('x^2/a^2 + y^2/b^2 - z^2/c^2 = 0');
set(t2, 'FontSize',16);

subplot(1,3,3);
fimplicit3(x^2./a^2 + y^2./b^2 - z^2./c^2 + 1);
axis equal;
colormap(jet);
t3 = title('x^2/a^2 + y^2/b^2 - z^2/c^2 = -1');
set(t3, 'FontSize',16);
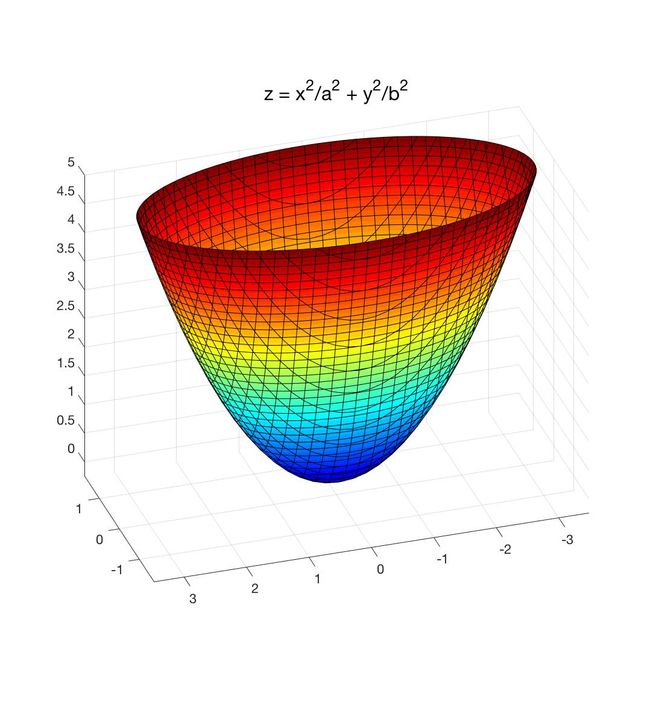
例:椭圆抛物面(Elliptic Paraboloid)
syms x y z;
a = 1; b = 2;
fimplicit3(x^2./a^2 + y^2./b^2 - z*0.5);

axis equal;
colormap(jet);
t1 = title('z = x^2/a^2 + y^2/b^2');
set(t1, 'FontSize',16);
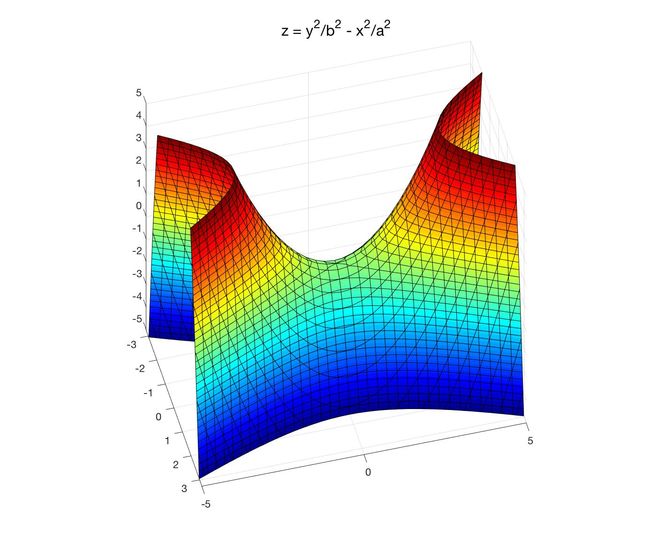
例:双曲抛物面 Hyperbolic Paraboloid (画法一:马鞍)
x = -3.5 : 0.2 : 3.5;  y = -3.5 : 0.2 : 3.5;
[X,Y] = meshgrid(x,y);
a = 2;  b = 2;
Z = (Y.^2)./(b^2) - (X.^2)./(a^2);
surf(X,Y,Z);

set(gca,'FontSize', 16);
zlabel('z');
xlim([-4 4]); xlabel('x');
ylim([-4 4]); ylabel('y');
colormap(jet);
t1 = title('z = y^2/b^2 - x^2/a^2');
set(t1, 'FontSize',16);
axis normal;
例:双曲抛物面 Hyperbolic Paraboloid (画法二:洋芋片)
syms x y z;
a = 1; b = 2;
fimplicit3(y^2./b^2 - x^2./a^2 - z*0.5);
axis equal;
colormap(jet);
t1 = title('z = y^2/b^2 - x^2/a^2');
set(t1, 'FontSize',16);
