Xperf Basics: Recording a Trace
http://randomascii.wordpress.com/2011/08/18/xperf-basics-recording-a-trace/
This post is obsolete – deprecated. For information on newer/easier/better ways of recording xperf traces see Xperf Basics: Recording a Trace (the easy way).
The Windows Performance Toolkit, also known as xperf, is a powerful (and free!) set of tools from Microsoft that allow profiling of all aspects of a Windows computer by using ETW (Event Tracing for Windows). Whether your performance issues are caused by excess CPU usage, waiting on file I/O, or interactions with drivers and other software, xperf usually provides the information needed to diagnose what is going on.
In addition to using xperf to diagnose dozens of tricky performance problems in the software that I work on I have used it to find (and both workaround and report) performance problems in:
- VirtualAlloc
- PowerPoint
- Visual Studio (breakpoint related hangs, SQL access hangs, network access hangs, etc.)
- Windows Live Photo Gallery
But, there is a problem. Xperf is difficult to learn, and the documentation is, well,imperfect. I hope to share some of what I have learned so that this valuable tool can be used by more developers, to make their software more awesome.
This post gives some resources on that most basic of problems, “how do I record a useful xperf trace that contains the information I’m likely to need.”
Recording a trace
Xperf is a command line tool with a bewildering array of options. Some of the things that you might need to specify when recording a trace are:
- What kernel providers (context switches, virtual allocs, sampling profiler, disk I/O) do you want to record?
- What events do you want call stacks for?
- How many memory buffers do you want, and what size do you want them to be?
For best results you should also record product-specific events from a user-mode provider. This requires that you learn:
- How to write a provider manifest
- How to ensure portability to non-Windows platforms (compile-time checks) and pre-Vista platforms (run-time checks)
And so on. It’s a lot to learn and while the basics of recording a kernel trace with a couple of kernel providers are covered pretty well it can be difficult to even find out what other options might be useful.
I have no intention of writing full documentation for xperf. Instead I am going to provide and explain the user-mode providers and the batch files that I use to record traces. That at least should get those interested in xperf off to a better start.
Step 1 – get xperf
Xperf is distributed as part of the Windows Software Development Kit. There are many valuable tools in there, but that’s the topic of another post. For now, run the installer for the latest Platform SDK (currently version 8.0, found here as of May 2012). You will find Windows Performance Toolkit which is the official name for xperf. Install it. You can do what you want with the rest of the Platform SDK. The appropriate version for your operating system (32-bit or 64-bit) will be installed – I found it hidden in “C:\Program Files\Windows Kits\8.0\Windows Performance Toolkit”. The redistributable packages for all Windows flavors, to make installing on other machines easier, should be found at “C:\Program Files (x86)\Windows Kits\8.0\Windows Performance Toolkit\Redistributables”. Make sure the install directory is in your path, then move on.
Step 2 – get the sample providers and batch files
You can download my sample user-mode ETW providers from ftp://ftp.cygnus-software.com/pub/MultiProvider.zip. I’ll wait.
When you unzip the file you’ll find a Visual Studio 2010 solution file. Build the debug or release configuration. You might want to poke around and look at the ReadMe.txt file, the provider manifest file (etwprovider.man) and the batch files.
Step 3 – record a trace
Now things start getting messy. I’m going to try to document all of the necessary steps and gotchas but it’s hard to make it really fool proof.
If you are running 64-bit Windows then there is a registry key that you need to set. And then you need to reboot. The registry key tells Windows to keep information needed for stack walking in non-pageable memory. If you run the command below from an elevated command prompt (yes, it is all one line that is excessively wordwrapped) and then reboot then your call stacks will thank you.
REG ADD "HKLM\System\CurrentControlSet\Control\Session Manager\Memory Management" -v DisablePagingExecutive -d 0x1 -t REG_DWORD -f
In order to use user-mode providers you have to register them. The etwregister.bat file is for that purpose. Like most things xperf you need to open up an administrator command prompt. Navigate to the directory containing etwregister.bat and run it. It should be able to find the MultiProvider.exe that you built (which contains the providers) and etwprovider.man (which defines them) and register them with wevtutil.exe.
Now run etwrecord.bat. Normally I give it the name of a trace file to record to like “etwrecord.bat c:\temp\testtrace.etl”. If you don’t give it a name then it will manufacture one. Either way be careful not to have spaces in your path. At this point tracing has been started. Detailed information about the operation of your computer is being recorded. If you get error messages at this point then read them carefully. Make sure the etwregister.bat step worked properly. Make sure you are running from an administrator command prompt. Make sure you are running Windows 7 (ideal) or Windows Vista in a pinch. ETW tracing is very limited in XP and I have done zero testing on that platform.
Now run the MultiProvider.exe that you built way back in step 2. It will emit some ETW events that your trace is set up to record.
Once MultiProvider.exe has exited you should return to the command prompt and press the ‘any key’ to continue. At this point your trace will be saved to disk. Make sure your trace file name doesn’t contain any spaces because it’s very difficult to get batch files to handle that correctly – and mine don’t. Again, if anything goes wrong then you’ll have to examine the error messages and suggestions very carefully.
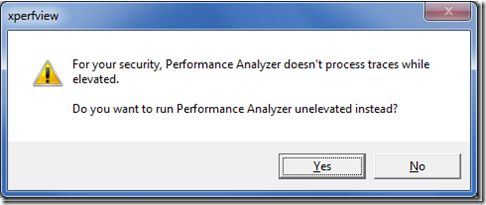
In order to be helpful the batch file will launch xperfview to view the trace. Since the batch file is running as administrator, and since xperfview doesn’t process traces while elevatedyou will get this dialog. Read the link above for details, or just click Yes to view the trace or No to cancel.
Step 4 – looking at the user events
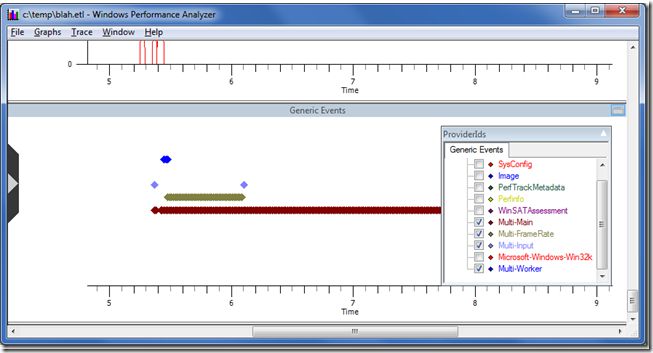
To find the user-provider events – which are great for offering context when looking at the kernel trace data – go to the Generic Events graph in xperfview. It should be at the bottom. You can hover over the diamonds to get a summary of each event. Some of the events are random Windows events with minimal value so I usually use the ProviderIDs configuration dropdown to turn off all except for mine, which are creatively named Multi-Main, etc.
The blue diamonds are designed for worker thread events, the two purple diamonds (your colours may vary) in the screen shot above are faked up input events. The green diamonds are faked up events that indicate the beginning of a frame, as in a video game. The brown diamonds are generic events. The whole purpose of having multiple providers is so that they will show up on different rows in this view. By carefully selecting when to use each provider you can make patterns (such as high and low frame rates, or high and low packet frequencies) visually obvious.
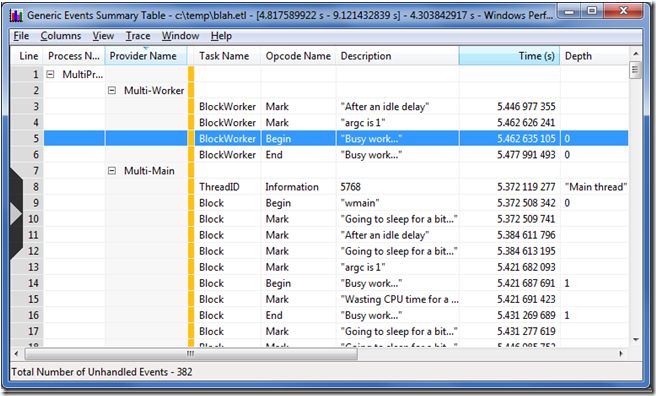
To get more details you need to select a range of time on the graph, right click, and request a summary table. Summary tables are a complex topic, but for now suffice it to say that by enabling and disabling columns to show the ones that you care about, by reordering columns (paying close attention to the gold bar – columns to the left of it are used for hierarchical grouping), and by careful sorting you can answer many questions. Effective use of pivot tables is an art form and is crucial to getting full value from xperf.
On the summary table below we can see, for instance, that the obviously important task “Busy work…” started 5.462635 seconds into the trace, and ended 5.477991493 into the trace. That information then helps us make sense of the other graphs on the main window because they all share a common timeline. Or at least it would if we were profiling something real. Use your imagination and pretend that those Begin/End markers are helping you identify when your AI code is running, or when map loading occurred, or whatever significant event that is taking too long that you want to investigate.
Step 5 – customize it for your purposes
In order to integrate this into your projects and start squashing performance bugs you need to change some things.
- Copy etwprof.* and ETWProvider.man to one of your projects – the DLL or EXE that will contain the providers. You’ll need to copy over the custom build steps for ETWProvider.man and include ETWProviderGenerated.rc (created by those custom build steps) into your existing resource file.
- Modify ETWProvider.man and ETWRegister.bat to change the name of the DLL or EXE that will contain the providers
- Change all of the GUIDs and provider names in ETWProvider.man
- Make the same provider name changes in ETWCommonSettings.bat (so that tracing enables the correct providers) and etwprof.cpp (to adjust the run-time registering of the providers and the emitting of events)
- Run the updated ETWRegister.bat to register your providers – make sure this succeeds.
At that point you should be able to build your code, register your providers, add some calls to your event emitting functions, and record traces that contain your user events.
Step 6 – bonus!
As an extra bonus, when etwrecord.bat finishes it actually leaves tracing running. Tracing continues to a circular buffer and at any time you can save that buffer (retroactive profiling!) to disk with “etwcirc.bat c:\temp\retrotrace.etl”. If you don’t like wasting memory on those circular buffers, “etwcirc.bat stop” will fix things for you.
Step 7 – detailed analysis
Analyzing traces is a huge topic, full of undocumented summary tables, and it will have to be saved for another post.
Step 8 – understanding how it works
This isn’t really a step, but a section to explain some of the details of how this works, to aid in customizing the batch files and providers. There are also lots of comments in the batch files and source code which should be used as a resource.
If you type “etwrecord test.etl” then xperf.exe will be invoked a few times. Once immediately:
xperf -on Latency+POWER+DISPATCHER+FILE_IO+FILE_IO_INIT -stackwalk PROFILE+CSWITCH+READYTHREAD -buffersize 1024 -minbuffers 300 -start gamesession -on Microsoft-Windows-Win32k+Multi-MAIN+Multi-FrameRate+Multi-Input+Multi-Worker
The first command starts tracing. “-on” indicates that the kernel provider should be started, and the plus-sign separated words that follow are individual kernel providers (POWER+DISPATCHER+FILE_IO+FILE_IO_INIT) and kernel provider groups (Latency). See “xperf -providers k” for a list of kernel providers and “xperf -help start” for information on the very complex “-on” syntax.
Then, “-stackwalk” indicates which events should have call stacks recorded for them. Call stacks are very useful, but are also expensive. Note that if you turn on stack walks for an event that is not enabled then nothing happens. See Pigs Can Fly for details of this or look at “xperf -help stackwalk” to see the full list of flags.
Then the size and minimum number of buffers is specified. Setting this too high will waste memory, and too low risks losing events. Note that the buffer size is in KB, so the settings above request 300 MB of buffers for the kernel events. See “xperf -help start” for details.
Then we get to “-start gamesession” which requests that we start a user-mode logging session called gamesession. Any name will do, but only one session of that name can be running at a time. Following that is “-on” and a list of user-mode providers. The first one is a built-in Windows 7 provider. See “xperf -providers” for a list of user-mode providers. The others are the providers that are defined in MultiProvider.exe and registered with ETWregister.bat. Customizing these, in ETWCommonSettings.bat can be important.
Xperf is invoked again after you hit a key to stop tracing:
xperf -stop gamesession -stop -d test.etl
The “-stop gamesession” tells xperf to end our user-mode logging session. The “-stop” by itself then tells xperf to halt the kernel session. The “-d test.etl” tells xperf to take those just-stopped sessions and merge them into a single trace file, for integrated analysis.
There are also a couple of “xperf –loggers” commands. Those are there for diagnostic purposes. When things go awry this undocumented command gives a list of all active ETW sessions that can help understand what is going on.


