python数据分析个人学习读书笔记-目录索引
第9章--随机森林项目实战——气温预测(2/2)
第8章已经讲解过随机森林的基本原理,本章将从实战的角度出发,借助Python工具包完成气温预测任务,其中涉及多个模块,主要包含随机森林建模、特征选择、效率对比、参数调优等。这个例子实在太长了,分为3篇介绍。这是第2篇。
9.2数据与特征对结果影响分析
带着上节提出的问题,重新读取规模更大的数据,任务还是保持不变,需要分别观察数据量和特征的选择对结果的影响。
1 # 导入工具包
2 import pandas as pd 3 4 # 读取数据 5 features = pd.read_csv('data/temps_extended.csv') 6 features.head(5) 7 8 print('数据规模',features.shape)
数据规模 (2191, 12)
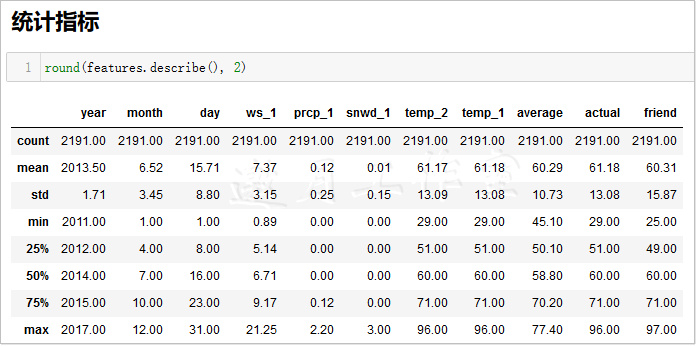
在新的数据中,数据规模发生了变化,数据量扩充到2191条,并且加入了以下3个新的天气特征。
- ws_1:前一天的风速。
- prcp_1:前一天的降水。
- snwd_1:前一天的积雪深度。
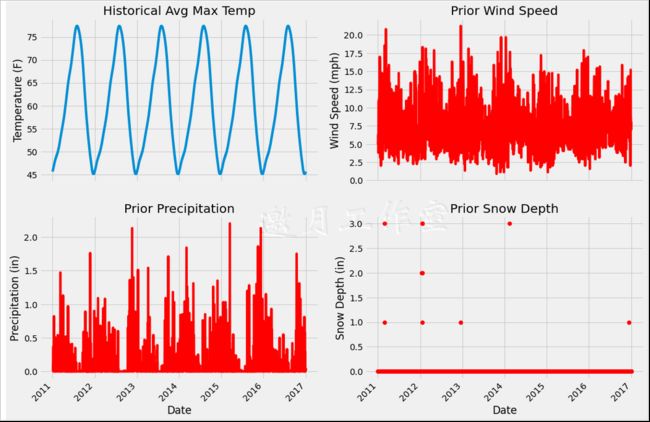
既然有了新的特征,就可绘图进行可视化展示。
 1 # 设置整体布局
 2 fig, ((ax1, ax2), (ax3, ax4)) = plt.subplots(nrows=2, ncols=2, figsize = (15,10))
 3 fig.autofmt_xdate(rotation = 45)  4  5 # 平均最高气温  6 ax1.plot(dates, features['average'])  7 ax1.set_xlabel(''); ax1.set_ylabel('Temperature (F)'); ax1.set_title('Historical Avg Max Temp')  8  9 # 风速 10 ax2.plot(dates, features['ws_1'], 'r-') 11 ax2.set_xlabel(''); ax2.set_ylabel('Wind Speed (mph)'); ax2.set_title('Prior Wind Speed') 12 13 # 降水 14 ax3.plot(dates, features['prcp_1'], 'r-') 15 ax3.set_xlabel('Date'); ax3.set_ylabel('Precipitation (in)'); ax3.set_title('Prior Precipitation') 16 17 # 积雪 18 ax4.plot(dates, features['snwd_1'], 'ro') 19 ax4.set_xlabel('Date'); ax4.set_ylabel('Snow Depth (in)'); ax4.set_title('Prior Snow Depth') 20 21 plt.tight_layout(pad=2)
加入3项新的特征,看起来很好理解,可视化展示的目的一方面是观察特征情况,另一方面还需考虑其数值是否存在问题,因为通常拿到的数据并不是这么干净的,当然这个例子的数据还是非常友好的,直接使用即可。
9.2.1特征工程
在数据分析和特征提取的过程中,出发点都是尽可能多地选择有价值的特征,因为初始阶段能得到的信息越多,建模时可以利用的信息也越多。随着大家做机器学习项目的深入,就会发现一个现象:建模之后,又想到一些可以利用的数据特征,再回过头来进行数据的预处理和体征提取,然后重新进行建模分析。
反复提取特征后,最常做的就是进行实验对比,但是如果数据量非常大,进行一次特征提取花费的时间就相对较多,所以,建议大家在开始阶段尽可能地完善预处理与特征提取工作,也可以多制定几套方案进行对比分析。
例如,在这份数据中有完整的日期特征,显然天气的变换与季节因素有关,但是,在原始数据集中,并没有体现出季节特征的指标,此时可以自己创建一个季节变量,将之当作新的特征,无论对建模还是分析都会起到帮助作用。
 1 # 创建一个季节变量
 2 seasons = []
 3  4 for month in features['month']:  5 if month in [1, 2, 12]:  6 seasons.append('winter')  7 elif month in [3, 4, 5]:  8 seasons.append('spring')  9 elif month in [6, 7, 8]: 10 seasons.append('summer') 11 elif month in [9, 10, 11]: 12 seasons.append('fall') 13 14 # 有了季节我们就可以分析更多东西了 15 reduced_features = features[['temp_1', 'prcp_1', 'average', 'actual']] 16 # reduced_features=reduced_features.copy() 17 reduced_features['season'] = seasons 18 19 ####reduced_features['season']=None #增加一个新列 20 21 # reduced_features=reduced_features.copy() 22 23 # for k in range(0,len(seasons)): 24 # reduced_features.loc[k,'season']=seasons[k] 25 26 # reduced_features.loc[:, 'season'] = '30' #设置一个整列值 27 ####print(reduced_features.columns) #列名所有 28 # print(reduced_features.columns[4]) #列名season 29 ####print(reduced_features.iloc[:,4]) #第5列值 30 # print(reduced_features.iloc[:,3]) #第4列值 31 32 33 # for label, content in reduced_features.items(): 34 # print('label:', label) 35 # print('content:', content, sep='\n') 36 37 38 print(round(reduced_features.describe(),2)) 39 # print(len(reduced_features)) ##2191 40 # print(reduced_features.shape[1]) #列数5 41 # print(reduced_features.shape[0]) #行数2191 42 # print(reduced_features.columns[4]) #列名season 43 # print(reduced_features.loc[0,'season']) #找不到列?? KeyError: 'season' 44 print(reduced_features.loc[:,'season']) #找不到列?? KeyError: 'season' 45 # https://pandas.pydata.org/pandas-docs/stable/reference/api/pandas.DataFrame.loc.html 46 # print(reduced_features.loc['season'])
此处注意:第17行会引发一个警告:
/* d:\tools\python37\lib\site-packages\ipykernel_launcher.py:16: SettingWithCopyWarning:
A value is trying to be set on a copy of a slice from a DataFrame.
Try using .loc[row_indexer,col_indexer] = value instead
See the caveats in the documentation: https://pandas.pydata.org/pandas-docs/stable/user_guide/indexing.html#returning-a-view-versus-a-copy
app.launch_new_instance()
*/
两个解决方案:
 1 #两个方案:
 2 #1、加copy  3  4 reduced_features=reduced_features.copy()  5 reduced_features['season'] = seasons  6  7 #2、使用loc赋值  8  9 # reduced_features.loc[:,'season'] = seasons 10 11 #将切分后的list数据存入df中 12 for k in range(0,len(seasons)): 13 reduced_features.loc[k,'season']=seasons[k]
有了季节特征之后,如果想观察一下不同季节时上述各项特征的变化情况该怎么做呢?这里给大家推荐一个非常实用的绘图函数pairplot(),需要先安装seaborn工具包(pip install seaborn),它相当于是在Matplotlib的基础上进行封装,用起来更简单方便:
 1  导入seaborn工具包
 2 import seaborn as sns
 3 sns.set(style="ticks", color_codes=True);  4  5 # 选择你喜欢的颜色模板  6 palette = sns.xkcd_palette(['dark blue', 'dark green', 'gold', 'orange'])  7  8 # 绘制pairplot  9 # help(sns.pairplot) 10 # https://seaborn.pydata.org/generated/seaborn.pairplot.html#seaborn.pairplot 11 #默认参数 12 # sns.pairplot(reduced_features,hue=None, hue_order=None, palette=None, vars=None, x_vars=None, y_vars=None, 13 # kind='scatter', diag_kind='auto', markers=None, height=2.5, aspect=1, 14 # corner=False, dropna=True, plot_kws=None, diag_kws=None, grid_kws=None, size=None) 15 16 sns.pairplot(reduced_features, hue = 'season', diag_kind='reg', palette= palette, plot_kws=dict(alpha = 0.7), 17 diag_kws=dict(shade=True)); 18 19 sns.pairplot(reduced_features,dropna=True,hue = 'season', diag_kind='kde', palette= palette, plot_kws=dict(alpha = 0.7), 20 diag_kws=dict(shade=True));
原书代码,一直报错,看了官方文档,没有解决方案。
https://seaborn.pydata.org/generated/seaborn.pairplot.html#seaborn.pairplot
d:\tools\python37\lib\site-packages\statsmodels\nonparametric\bandwidths.py in select_bandwidth(x, bw, kernel)
    172         # eventually this can fall back on another selection criterion.
    173         err = "Selected KDE bandwidth is 0. Cannot estimate density." --> 174 raise RuntimeError(err) 175 else: 176 return bandwidth RuntimeError: Selected KDE bandwidth is 0. Cannot estimate density.
注意:对角线的图没有生成。
上述输出结果显示,x轴和y轴都是temp_1、prcp_1、average、actual这4项指标,不同颜色的点表示不同的季节(通过hue参数来设置),在主对角线上x轴和y轴都是用相同特征表示其在不同季节时的数值分布情况,其他位置用散点图来表示两个特征之间的关系,例如左下角temp_1和actual就呈现出很强的相关性。
9.2.2数据量对结果影响分析
接下来就要进行一系列对比实验,第一个问题就是当数据量增多时,使用同样的方法建模,结果会不会发生改变呢?还是先切分新的数据集吧:
 1 # 独热编码
 2 features = pd.get_dummies(features)
 3  4 # 提取特征和标签  5 labels = features['actual']  6 features = features.drop('actual', axis = 1)  7  8 # 特征名字留着备用  9 feature_list = list(features.columns) 10 11 # 转换成所需格式 12 import numpy as np 13 14 features = np.array(features) 15 labels = np.array(labels) 16 17 # 数据集切分 18 from sklearn.model_selection import train_test_split 19 20 train_features, test_features, train_labels, test_labels = train_test_split(features, labels, 21 test_size = 0.25, random_state = 0) 22 23 print('训练集特征:', train_features.shape) 24 print('训练集标签:', train_labels.shape) 25 print('测试集特征:', test_features.shape) 26 print('测试集标签:', test_labels.shape)
训练集特征: (1643, 17)
训练集标签: (1643,)
测试集特征: (548, 17)
测试集标签: (548,)
新的数据集由1643个训练样本和548个测试样本组成。为了进行对比实验,还需使用相同的测试集来对比结果,由于重新打开了一个新的Notebook代码片段,所以还需再对样本较少的老数据集再次执行相同的预处理:
 1 # 工具包导入
 2 import pandas as pd  3  4 # 为了剔除特征个数对结果的影响,这里特征统一只有老数据集中特征  5 original_feature_indices = [feature_list.index(feature) for feature in  6 feature_list if feature not in  7 ['ws_1', 'prcp_1', 'snwd_1']]  8  9 # 读取老数据集 10 original_features = pd.read_csv('data/temps.csv') 11 12 original_features = pd.get_dummies(original_features) 13 14 import numpy as np 15 16 # 数据和标签转换 17 original_labels = np.array(original_features['actual']) 18 19 original_features= original_features.drop('actual', axis = 1) 20 21 original_feature_list = list(original_features.columns) 22 23 original_features = np.array(original_features) 24 25 # 数据集切分 26 from sklearn.model_selection import train_test_split 27 28 original_train_features, original_test_features, original_train_labels, original_test_labels = train_test_split(original_features, original_labels, test_size = 0.25, random_state = 42) 29 30 # 同样的树模型进行建模 31 from sklearn.ensemble import RandomForestRegressor 32 33 # 同样的参数与随机种子 34 rf = RandomForestRegressor(n_estimators= 100, random_state=0) 35 36 # 这里的训练集使用的是老数据集的 37 rf.fit(original_train_features, original_train_labels); 38 39 # 为了测试效果能够公平,统一使用一致的测试集,这里选择了刚刚我切分过的新数据集的测试集 40 predictions = rf.predict(test_features[:,original_feature_indices]) 41 42 # 先计算温度平均误差 43 errors = abs(predictions - test_labels) 44 45 print('平均温度误差:', round(np.mean(errors), 2), 'degrees.') 46 47 # MAPE 48 mape = 100 * (errors / test_labels) 49 50 # 这里的Accuracy为了方便观察,我们就用100减去误差了,希望这个值能够越大越好 51 accuracy = 100 - np.mean(mape) 52 print('Accuracy:', round(accuracy, 2), '%.')
平均温度误差: 4.67 degrees.
Accuracy: 92.2 %.
上述输出结果显示平均温度误差为4.67,这是样本数量较少时的结果,再来看看样本数量增多时效果会提升吗:
 1 from sklearn.ensemble import RandomForestRegressor
 2
 3 # 剔除掉新的特征,保证数据特征是一致的  4 original_train_features = train_features[:,original_feature_indices]  5  6 original_test_features = test_features[:, original_feature_indices]  7  8 rf = RandomForestRegressor(n_estimators= 100 ,random_state=0)  9 10 rf.fit(original_train_features, train_labels); 11 12 # 预测 13 baseline_predictions = rf.predict(original_test_features) 14 15 # 结果 16 baseline_errors = abs(baseline_predictions - test_labels) 17 18 print('平均温度误差:', round(np.mean(baseline_errors), 2), 'degrees.') 19 20 # (MAPE) 21 baseline_mape = 100 * np.mean((baseline_errors / test_labels)) 22 23 # accuracy 24 baseline_accuracy = 100 - baseline_mape 25 print('Accuracy:', round(baseline_accuracy, 2), '%.')
平均温度误差: 4.2 degrees.
Accuracy: 93.12 %.
可以看到,当数据量增大之后,平均温度误差为4.2,效果发生了一些提升,这也符合实际情况,在机器学习任务中,都是希望数据量能够越大越好,一方面能让机器学习得更充分,另一方面也会降低过拟合的风险。
9.2.3特征数量对结果影响分析
下面对比一下特征数量对结果的影响,之前两次比较没有加入新的天气特征,这次把降水、风速、积雪3项特征加入数据集中,看看效果怎样:
 1 # 准备加入新的特征
 2 from sklearn.ensemble import RandomForestRegressor  3  4 rf_exp = RandomForestRegressor(n_estimators= 100, random_state=0)  5 rf_exp.fit(train_features, train_labels)  6  7 # 同样的测试集  8 predictions = rf_exp.predict(test_features)  9 10 # 评估 11 errors = abs(predictions - test_labels) 12 13 print('平均温度误差:', round(np.mean(errors), 2), 'degrees.') 14 15 # (MAPE) 16 mape = np.mean(100 * (errors / test_labels)) 17 18 # 看一下提升了多少 19 improvement_baseline = 100 * abs(mape - baseline_mape) / baseline_mape 20 print('特征增多后模型效果提升:', round(improvement_baseline, 2), '%.') 21 22 # accuracy 23 accuracy = 100 - mape 24 print('Accuracy:', round(accuracy, 2), '%.')
平均温度误差: 4.05 degrees.
特征增多后模型效果提升: 3.34 %.
Accuracy: 93.35 %.
模型整体效果有了略微提升,可以发现在建模过程中,每一次改进都会使得结果发生部分提升,不要小看这些,累计起来就是大成绩。
继续研究特征重要性这个指标,虽说只供参考,但是业界也有经验值可供参考:
 1 # 特征名字
 2 importances = list(rf_exp.feature_importances_)
 3
 4 # 名字,数值组合在一起
 5 feature_importances = [(feature, round(importance, 2)) for feature, importance in zip(feature_list, importances)]
 6
 7 # 排序
 8 feature_importances = sorted(feature_importances, key = lambda x: x[1], reverse = True)
 9
10 # 打印出来
11 [print('特征: {:20} 重要性: {}'.format(*pair)) for pair in feature_importances];
特征: temp_1               重要性: 0.85
特征: average              重要性: 0.05
特征: ws_1                 重要性: 0.02
特征: friend               重要性: 0.02
特征: year                 重要性: 0.01
特征: month                重要性: 0.01
特征: day                  重要性: 0.01
特征: prcp_1               重要性: 0.01
特征: temp_2               重要性: 0.01
特征: snwd_1               重要性: 0.0
特征: weekday_Fri          重要性: 0.0
特征: weekday_Mon          重要性: 0.0
特征: weekday_Sat          重要性: 0.0
特征: weekday_Sun          重要性: 0.0
特征: weekday_Thurs        重要性: 0.0
特征: weekday_Tues         重要性: 0.0
特征: weekday_Wed          重要性: 0.0
对各个特征的重要性排序之后,打印出其各自结果,排在前面的依旧是temp_1和average,风速ws_1虽然也上榜了,但是影响还是略小,好长一串数据看起来不方便,还是用图表显示更清晰明了。
 1 # 指定风格
 2 plt.style.use('fivethirtyeight')
 3
 4 # 指定位置
 5 x_values = list(range(len(importances)))
 6
 7 # 绘图
 8 plt.bar(x_values, importances, orientation = 'vertical', color = 'r', edgecolor = 'k', linewidth = 1.2)
 9
10 # x轴名字得竖着写
11 plt.xticks(x_values, feature_list, rotation='vertical')
12
13 # 图名
14 plt.ylabel('Importance'); plt.xlabel('Variable'); plt.title('Variable Importances');
虽然能通过柱形图表示每个特征的重要程度,但是具体选择多少个特征来建模还是有些模糊。此时可以使用cumsum()函数,先把特征按照其重要性进行排序,再算其累计值,例如cumsum([1,2,3,4])表示得到的结果就是其累加值(1,3,6,10)。然后设置一个阈值,通常取95%,看看需要多少个特征累加在一起之后,其特征重要性的累加值才能超过该阈值,就将它们当作筛选后的特征:
 1 # 对特征进行排序
 2 sorted_importances = [importance[1] for importance in feature_importances]
 3 sorted_features = [importance[0] for importance in feature_importances]
 4
 5 # 累计重要性
 6 cumulative_importances = np.cumsum(sorted_importances)
 7
 8 # 绘制折线图
 9 plt.plot(x_values, cumulative_importances, 'g-')
10
11 # 画一条红色虚线,0.95那
12 plt.hlines(y = 0.95, xmin=0, xmax=len(sorted_importances), color = 'r', linestyles = 'dashed')
13
14 # X轴
15 plt.xticks(x_values, sorted_features, rotation = 'vertical')
16
17 # Y轴和名字
18 plt.xlabel('Variable'); plt.ylabel('Cumulative Importance'); plt.title('Cumulative Importances');
由输出结果可见,当第5个特征出现的时候,其总体的累加值超过95%,那么接下来就可以进行对比实验了,如果只用这5个特征建模,结果会怎么样呢?时间效率又会怎样呢?
1 # 看看有几个特征
2 print('Number of features for 95% importance:', np.where(cumulative_importances > 0.95)[0][0] + 1)
3
4 #Number of features for 95% importance: 5
 1 # 选择这些特征
 2 important_feature_names = [feature[0] for feature in feature_importances[0:5]]
 3 # 找到它们的名字
 4 important_indices = [feature_list.index(feature) for feature in important_feature_names]
 5
 6 # 重新创建训练集
 7 important_train_features = train_features[:, important_indices]
 8 important_test_features = test_features[:, important_indices]
 9
10 # 数据维度
11 print('Important train features shape:', important_train_features.shape)
12 print('Important test features shape:', important_test_features.shape)
Important train features shape: (1643, 5)
Important test features shape: (548, 5)
 1 # 再训练模型
 2 rf_exp.fit(important_train_features, train_labels);
 3
 4 # 同样的测试集
 5 predictions = rf_exp.predict(important_test_features)
 6
 7 # 评估结果
 8 errors = abs(predictions - test_labels)
 9
10 print('平均温度误差:', round(np.mean(errors), 2), 'degrees.')
11
12 mape = 100 * (errors / test_labels)
13
14 # accuracy
15 accuracy = 100 - np.mean(mape)
16 print('Accuracy:', round(accuracy, 2), '%.')
平均温度误差: 4.11 degrees.
Accuracy: 93.28 %.
看起来奇迹并没有出现,本以为效果可能会更好,但其实还是有一点点下降,可能是由于树模型本身具有特征选择的被动技能,也可能是剩下5%的特征确实有一定作用。虽然模型效果没有提升,还可以再看看在时间效率的层面上有没有进步:
 1 # 要计算时间了
 2 import time
 3
 4 # 这次是用所有特征
 5 all_features_time = []
 6
 7 # 算一次可能不太准,来10次取个平均
 8 for _ in range(10):
 9     start_time = time.time()
10     rf_exp.fit(train_features, train_labels)
11     all_features_predictions = rf_exp.predict(test_features)
12     end_time = time.time()
13     all_features_time.append(end_time - start_time)
14
15 all_features_time = np.mean(all_features_time)
16 print('使用所有特征时建模与测试的平均时间消耗:', round(all_features_time, 2), '秒.')
使用所有特征时建模与测试的平均时间消耗: 0.7 秒.
当使用全部特征的时候,建模与测试用的总时间为0.7秒,由于机器性能不同,可能导致执行的速度不一样,在笔记本电脑上运行时间可能要稍微长一点。再来看看只选择高特征重要性数据的结果:
 1 # 这次是用部分重要的特征
 2 reduced_features_time = []
 3
 4 # 算一次可能不太准,来10次取个平均
 5 for _ in range(10):
 6     start_time = time.time()
 7     rf_exp.fit(important_train_features, train_labels)
 8     reduced_features_predictions = rf_exp.predict(important_test_features)
 9     end_time = time.time()
10     reduced_features_time.append(end_time - start_time)
11
12 reduced_features_time = np.mean(reduced_features_time)
13 print('使用所有特征时建模与测试的平均时间消耗:', round(reduced_features_time, 2), '秒.')
使用所有特征时建模与测试的平均时间消耗: 0.44 秒.
唯一改变的就是输入数据的规模,可以发现使用部分特征时试验的时间明显缩短,因为决策树需要遍历的特征少了很多。下面把对比情况展示在一起,更方便观察:
 1 # 用分别的预测值来计算评估结果
 2 all_accuracy =  100 * (1- np.mean(abs(all_features_predictions - test_labels) / test_labels))
 3 reduced_accuracy = 100 * (1- np.mean(abs(reduced_features_predictions - test_labels) / test_labels))
 4
 5 #创建一个df来保存结果
 6 comparison = pd.DataFrame({'features': ['all (17)', 'reduced (5)'],
 7                            'run_time': [round(all_features_time, 2), round(reduced_features_time, 2)],
 8                            'accuracy': [round(all_accuracy, 2), round(reduced_accuracy, 2)]})
 9
10 comparison[['features', 'accuracy', 'run_time']]
        features     accuracy     run_time
0     all (17)       93.35       0.70
1     reduced (5)    93.28       0.44
这里的准确率只是为了观察方便自己定义的,用于对比分析,结果显示准确率基本没发生明显变化,但是在时间效率上却有明显差异。所以,当大家在选择算法与数据的同时,还需要根据实际业务具体分析,例如很多任务都需要实时进行响应,这时候时间效率可能会比准确率更优先考虑。可以通过具体数值看一下各自效果的提升:
relative_accuracy_decrease = 100 * (all_accuracy - reduced_accuracy) / all_accuracy
print('相对accuracy下降:', round(relative_accuracy_decrease, 3), '%.')

relative_runtime_decrease = 100 * (all_features_time - reduced_features_time) / all_features_time
print('相对时间效率提升:', round(relative_runtime_decrease, 3), '%.')
相对accuracy下降: 0.071 %.
相对时间效率提升: 38.248 %.
实验结果显示,时间效率的提升相对更大,而且基本保证模型效果。最后把所有的实验结果汇总到一起进行对比:
 1 # 绘图来总结把
 2 # 设置总体布局,还是一整行看起来好一些
 3 fig, (ax1, ax2, ax3) = plt.subplots(nrows=1, ncols=3, figsize = (16,5), sharex = True)
 4
 5 # X轴
 6 x_values = [0, 1, 2]
 7 labels = list(model_comparison['model'])
 8 plt.xticks(x_values, labels)
 9
10 # 字体大小
11 fontdict = {'fontsize': 18}
12 fontdict_yaxis = {'fontsize': 14}
13
14 # 预测温度和真实温度差异对比
15 ax1.bar(x_values, model_comparison['error (degrees)'], color = ['b', 'r', 'g'], edgecolor = 'k', linewidth = 1.5)
16 ax1.set_ylim(bottom = 3.5, top = 4.5)
17 ax1.set_ylabel('Error (degrees) (F)', fontdict = fontdict_yaxis);
18 ax1.set_title('Model Error Comparison', fontdict= fontdict)
19
20 # Accuracy 对比
21 ax2.bar(x_values, model_comparison['accuracy'], color = ['b', 'r', 'g'], edgecolor = 'k', linewidth = 1.5)
22 ax2.set_ylim(bottom = 92, top = 94)
23 ax2.set_ylabel('Accuracy (%)', fontdict = fontdict_yaxis);
24 ax2.set_title('Model Accuracy Comparison', fontdict= fontdict)
25
26 # 时间效率对比
27 ax3.bar(x_values, model_comparison['run_time (s)'], color = ['b', 'r', 'g'], edgecolor = 'k', linewidth = 1.5)
28 ax3.set_ylim(bottom = 0, top = 1)
29 ax3.set_ylabel('Run Time (sec)', fontdict = fontdict_yaxis);
30 ax3.set_title('Model Run-Time Comparison', fontdict= fontdict);
31
32 # Find the original feature indices
33 original_feature_indices = [feature_list.index(feature) for feature in
34                                       feature_list if feature not in
35                                       ['ws_1', 'prcp_1', 'snwd_1']]
36
37 # Create a test set of the original features
38 original_test_features = test_features[:, original_feature_indices]
39
40 # Time to train on original data set (1 year)
41 original_features_time = []
42
43 # Do 10 iterations and take average for all features
44 for _ in range(10):
45     start_time = time.time()
46     rf.fit(original_train_features, original_train_labels)
47     original_features_predictions = rf.predict(original_test_features)
48     end_time = time.time()
49     original_features_time.append(end_time - start_time)
50
51 original_features_time = np.mean(original_features_time)
52
53 # Calculate mean absolute error for each model
54 original_mae = np.mean(abs(original_features_predictions - test_labels))
55 exp_all_mae = np.mean(abs(all_features_predictions - test_labels))
56 exp_reduced_mae = np.mean(abs(reduced_features_predictions - test_labels))
57
58 # Calculate accuracy for model trained on 1 year of data
59 original_accuracy = 100 * (1 - np.mean(abs(original_features_predictions - test_labels) / test_labels))
60
61 # Create a dataframe for comparison
62 model_comparison = pd.DataFrame({'model': ['original', 'exp_all', 'exp_reduced'],
63                                  'error (degrees)':  [original_mae, exp_all_mae, exp_reduced_mae],
64                                  'accuracy': [original_accuracy, all_accuracy, reduced_accuracy],
65                                  'run_time (s)': [original_features_time, all_features_time, reduced_features_time]})
66
67 # Order the dataframe
68 model_comparison = model_comparison[['model', 'error (degrees)', 'accuracy', 'run_time (s)']]
model     error (degrees)     accuracy     run_time (s)
0     original     4.667628     92.202816     0.176642
1     exp_all     4.049051     93.349629     0.704933
2     exp_reduced     4.113084     93.283485     0.435311
 1 # 绘图来总结把
 2 # 设置总体布局,还是一整行看起来好一些
 3 fig, (ax1, ax2, ax3) = plt.subplots(nrows=1, ncols=3, figsize = (16,5), sharex = True)
 4
 5 # X轴
 6 x_values = [0, 1, 2]
 7 labels = list(model_comparison['model'])
 8 plt.xticks(x_values, labels)
 9
10 # 字体大小
11 fontdict = {'fontsize': 18}
12 fontdict_yaxis = {'fontsize': 14}
13
14 # 预测温度和真实温度差异对比
15 ax1.bar(x_values, model_comparison['error (degrees)'], color = ['b', 'r', 'g'], edgecolor = 'k', linewidth = 1.5)
16 ax1.set_ylim(bottom = 3.5, top = 4.5)
17 ax1.set_ylabel('Error (degrees) (F)', fontdict = fontdict_yaxis);
18 ax1.set_title('Model Error Comparison', fontdict= fontdict)
19
20 # Accuracy 对比
21 ax2.bar(x_values, model_comparison['accuracy'], color = ['b', 'r', 'g'], edgecolor = 'k', linewidth = 1.5)
22 ax2.set_ylim(bottom = 92, top = 94)
23 ax2.set_ylabel('Accuracy (%)', fontdict = fontdict_yaxis);
24 ax2.set_title('Model Accuracy Comparison', fontdict= fontdict)
25
26 # 时间效率对比
27 ax3.bar(x_values, model_comparison['run_time (s)'], color = ['b', 'r', 'g'], edgecolor = 'k', linewidth = 1.5)
28 ax3.set_ylim(bottom = 0, top = 1)
29 ax3.set_ylabel('Run Time (sec)', fontdict = fontdict_yaxis);
30 ax3.set_title('Model Run-Time Comparison', fontdict= fontdict);
其中,original代表老数据,也就是数据量少且特征少的那部份;exp_all代表完整的新数据;exp_reduced代表按照95%阈值选择的部分重要特征数据集。结果很明显,数据量和特征越多,效果会提升一些,但是时间效率会有所下降。
最终模型的决策需要通过实际业务应用来判断,但是分析工作一定要做到位。
9.3模型调参
之前对比分析的主要是数据和特征层面,还有另一部分非常重要的工作等着大家去做,就是模型调参问题,在实验的最后,看一下对于树模型来说,应当如何进行参数调节。
调参是机器学习必经的一步,很多方法和经验并不是某一个算法特有的,基本常规任务都可以用于参考。
先来打印看一下都有哪些参数可供选择:
 1 import pandas as pd
 2 features = pd.read_csv('data/temps_extended.csv')
 3
 4 features = pd.get_dummies(features)
 5
 6 labels = features['actual']
 7 features = features.drop('actual', axis = 1)
 8
 9 feature_list = list(features.columns)
10
11 import numpy as np
12
13 features = np.array(features)
14 labels = np.array(labels)
15
16 from sklearn.model_selection import train_test_split
17
18 train_features, test_features, train_labels, test_labels = train_test_split(features, labels,
19                                                                             test_size = 0.25, random_state = 42)
20
21 print('Training Features Shape:', train_features.shape)
22 print('Training Labels Shape:', train_labels.shape)
23 print('Testing Features Shape:', test_features.shape)
24 print('Testing Labels Shape:', test_labels.shape)
25
26 print('{:0.1f} years of data in the training set'.format(train_features.shape[0] / 365.))
27 print('{:0.1f} years of data in the test set'.format(test_features.shape[0] / 365.))
28
29 important_feature_names = ['temp_1', 'average', 'ws_1', 'temp_2', 'friend', 'year']
30
31 important_indices = [feature_list.index(feature) for feature in important_feature_names]
32
33 important_train_features = train_features[:, important_indices]
34 important_test_features = test_features[:, important_indices]
35
36 print('Important train features shape:', important_train_features.shape)
37 print('Important test features shape:', important_test_features.shape)
38
39 train_features = important_train_features[:]
40 test_features = important_test_features[:]
41
42 feature_list = important_feature_names[:]
1 from sklearn.ensemble import RandomForestRegressor
2
3 rf = RandomForestRegressor(random_state = 42)
4
5 from pprint import pprint
6
7 # 打印所有参数
8 pprint(rf.get_params())
关于参数的解释,在决策树算法中已经作了介绍,当使用工具包完成任务的时候,最好先查看其API文档,每一个参数的意义和其输入数值类型一目了然
https://scikit-learn.org/stable/modules/classes.html
当大家需要查找某些说明的时候,可以直接按住Ctrl+F组合键在浏览器中搜索关键词,例如,要查找RandomForestRegressor,找到其对应位置单击进去即可。
https://scikit-learn.org/stable/modules/generated/sklearn.ensemble.RandomForestRegressor.html#sklearn.ensemble.RandomForestRegressor
这个地址栏你可以直接拼凑。
当数据量较大时,直接用工具包中的函数观察结果可能没那么直接,也可以自己先构造一个简单的输入来观察结果,确定无误后,再用完整数据执行。
9.3.1随机参数选择
调参路漫漫,参数的可能组合结果实在太多,假设有5个参数待定,每个参数都有10种候选值,那么一共有多少种可能呢(可不是5×10这么简单)?这个数字很大吧,实际业务中,由于数据量较大,模型相对复杂,所花费的时间并不少,几小时能完成一次建模就不错了。那么如何选择参数才是更合适的呢?如果依次遍历所有可能情况,那恐怕要到地老天荒了。
首先登场的是RandomizedSearchCV,这个函数可以帮助大家在参数空间中,不断地随机选择一组合适的参数来建模,并且求其交叉验证后的评估结果。
https://scikit-learn.org/stable/modules/generated/sklearn.model_selection.RandomizedSearchCV.html?highlight=randomizedsearchcv
为什么要随机选择呢?按顺序一个个来应该更靠谱,但是实在耗不起遍历寻找的时间,随机就变成一种策略。相当于对所有可能的参数随机进行测试,差不多能找到大致可行的位置,虽然感觉有点不靠谱,但也是无奈之举。该函数所需的所有参数解释都在API文档中有详细说明,准备好模型、数据和参数空间后,直接调用即可。
 1 from sklearn.model_selection import RandomizedSearchCV
 2
 3 # 建立树的个数
 4 n_estimators = [int(x) for x in np.linspace(start = 200, stop = 2000, num = 10)]
 5 # 最大特征的选择方式
 6 max_features = ['auto', 'sqrt']
 7 # 树的最大深度
 8 max_depth = [int(x) for x in np.linspace(10, 20, num = 2)]
 9 max_depth.append(None)
10 # 节点最小分裂所需样本个数
11 min_samples_split = [2, 5, 10]
12 # 叶子节点最小样本数,任何分裂不能让其子节点样本数少于此值
13 min_samples_leaf = [1, 2, 4]
14 # 样本采样方法
15 bootstrap = [True, False]
16
17 # Random grid
18 random_grid = {'n_estimators': n_estimators,
19                'max_features': max_features,
20                'max_depth': max_depth,
21                'min_samples_split': min_samples_split,
22                'min_samples_leaf': min_samples_leaf,
23                'bootstrap': bootstrap}
在这个任务中,只给大家举例进行说明,考虑到篇幅问题,所选的参数的候选值并没有给出太多。值得注意的是,每一个参数的取值范围都需要好好把控,因为如果参数范围不恰当,最后的结果肯定也不会好。可以参考一些经验值或者不断通过实验结果来调整合适的参数空间。
调参也是一个反复的过程,并不是说机器学习建模任务就是从前往后进行,实验结果确定之后,需要再回过头来反复对比不同的参数、不同的预处理方案。
这里先给大家解释一下RandomizedSearchCV中常用的参数,API文档中给出详细的说明,建议大家养成查阅文档的习惯。
- estimator:RandomizedSearchCV是一个通用的、并不是专为随机森林设计的函数,所以需要指定选择的算法模型是什么。
- distributions:参数的候选空间,上述代码中已经用字典格式给出了所需的参数分布。
- n_iter:随机寻找参数组合的个数,例如,n_iter=100,代表接下来要随机找100组参数的组合,在其中找到最好的。
- scoring:评估方法,按照该方法去找最好的参数组合。
- cv:交叉验证,之前已经介绍过。
- verbose:打印信息的数量,根据自己的需求。
- random_state:随机种子,为了使得结果能够一致,排除掉随机成分的干扰,一般都会指定成一个值,用你自己的幸运数字就好。
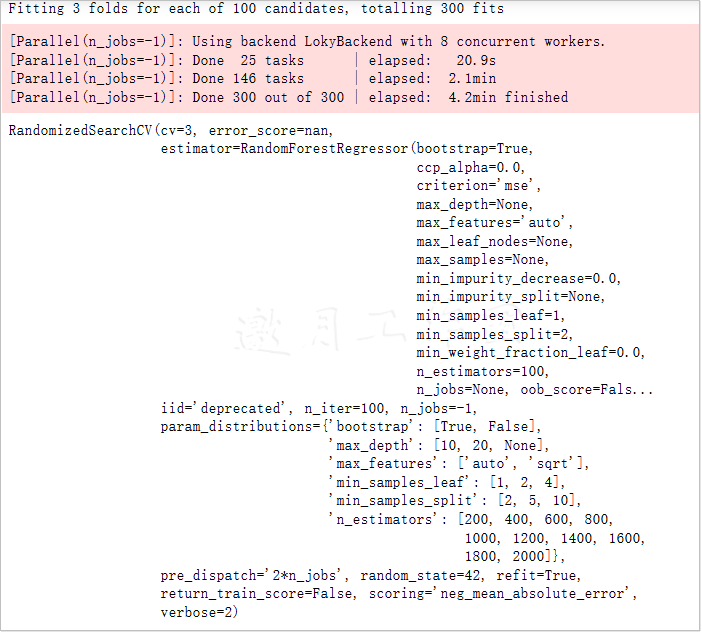
- n_jobs:多线程来跑这个程序,如果是−1,就会用所有的,但是可能会有点卡。即便把n_jobs设置成−1,程序运行得还是有点慢,因为要建立100次模型来选择参数,并且带有3折交叉验证,那就相当于300个任务。
RandomizedSearch结果中显示了任务执行过程中时间和当前的次数,如果数据较大,需要等待一段时间,只需简单了解中间的结果即可,最后直接调用rf_random.best_params_,就可以得到在这100次随机选择中效果最好的那一组参数:
1 # 随机选择最合适的参数组合
2 rf = RandomForestRegressor()
3
4 rf_random = RandomizedSearchCV(estimator=rf, param_distributions=random_grid,
5                               n_iter = 100, scoring='neg_mean_absolute_error',
6                               cv = 3, verbose=2, random_state=42, n_jobs=-1)
7
8 # 执行寻找操作
9 rf_random.fit(train_features, train_labels)
运行时间,主要看各位的CPU够不够硬核。
1 rf_random.best_params_
{'n_estimators': 1400,
 'min_samples_split': 10,
 'min_samples_leaf': 4,
 'max_features': 'auto',
 'max_depth': 10,
 'bootstrap': True}
完成100次随机选择后,还可以得到其他实验结果,在其API文档中给出了说明,这里就不一一演示了,喜欢动手的读者可以自己试一试。
接下来,对比经过随机调参后的结果和用默认参数结果的差异,所有默认参数在API中都有说明,例如n_estimators:integer,optional (default=10),表示在随机森林模型中,默认要建立树的个数是10。
一般情况下,参数都会有默认值,并不是没有给出参数就不需要它,而是代码中使用其默认值。
既然要进行对比分析,还是先给出评估标准,这与之前的实验一致:
1 def evaluate(model, test_features, test_labels):
2     predictions = model.predict(test_features)
3     errors = abs(predictions - test_labels)
4     mape = 100 * np.mean(errors / test_labels)
5     accuracy = 100 - mape
6
7     print('平均气温误差.',np.mean(errors))
8     print('Accuracy = {:0.2f}%.'.format(accuracy))
1 base_model = RandomForestRegressor( random_state = 42)
2 base_model.fit(train_features, train_labels)
3 evaluate(base_model, test_features, test_labels)
平均气温误差. 3.829032846715329
Accuracy = 93.56%.
1 best_random = rf_random.best_estimator_
2 evaluate(best_random, test_features, test_labels)
平均气温误差. 3.7145380641444214
Accuracy = 93.73%.
从上述对比实验中可以看到模型的效果提升了一些,原来误差为3.83,调参后的误差下降到3.71。但是这是上限吗?还有没有进步空间呢?之前讲解的时候,也曾说到随机参数选择是找到一个大致的方向,但肯定还没有做到完美,就像是警察抓捕犯罪嫌疑人,首先得到其大概位置,然后就要进行地毯式搜索。
9.3.2网络参数搜索
接下来介绍下一位参赛选手——GridSearchCV(),它要做的事情就跟其名字一样,进行网络搜索,也就是一个一个地遍历,不能放过任何一个可能的参数组合。就像之前说的组合有多少种,就全部走一遍,使用方法与RandomizedSearchCV()基本一致,只不过名字不同罢了。
https://scikit-learn.org/stable/modules/generated/sklearn.model_selection.GridSearchCV.html
 1 from sklearn.model_selection import GridSearchCV
 2
 3 # 网络搜索
 4 param_grid = {
 5     'bootstrap': [True],
 6     'max_depth': [8,10,12],
 7     'max_features': ['auto'],
 8     'min_samples_leaf': [2,3, 4, 5,6],
 9     'min_samples_split': [3, 5, 7],
10     'n_estimators': [800, 900, 1000, 1200]
11 }
12
13 # 选择基本算法模型
14 rf = RandomForestRegressor()
15
16 # 网络搜索
17 grid_search = GridSearchCV(estimator = rf, param_grid = param_grid,
18                            scoring = 'neg_mean_absolute_error', cv = 3,
19                            n_jobs = -1, verbose = 2)
20
21 # 执行搜索
22 grid_search.fit(train_features, train_labels)
运行时CPU持续100%,时间足够你热好水泡杯茶。
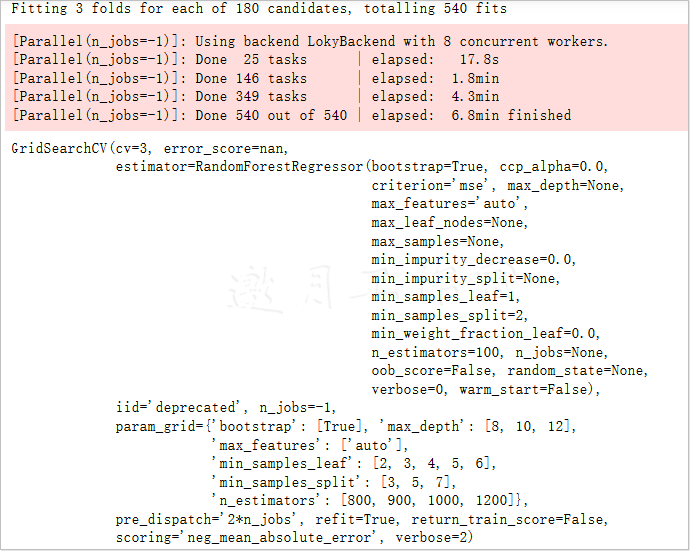
在使用网络搜索的时候,值得注意的就是参数空间的选择,是按照经验值还是猜测选择参数呢?之前已经有了一组随机参数选择的结果,相当于已经在大范围的参数空间中得到了大致的方向,接下来的网络搜索也应当基于前面的实验继续进行,把随机参数选择的结果当作接下来进行网络搜索的依据。相当于此时已经掌握了犯罪嫌疑人(最佳模型参数)的大致活动区域,要展开地毯式的抓捕了。
当数据量较大,没办法直接进行网络搜索调参时,也可以考虑交替使用随机和网络搜索策略来简化所需对比实验的次数。
经过再调整之后,算法模型的效果又有了一点提升,虽然只是一小点,但是把每一小步累计在一起就是一个大成绩。在用网络搜索的时候,如果参数空间较大,则遍历的次数太多,通常并不把所有的可能性都放进去,而是分成不同的小组分别执行,就像是抓捕工作很难地毯式全部搜索到,但是分成几个小组守在重要路口也是可以的。
下面再来看看另外一组网络搜索的参赛选手,相当于每一组候选参数的侧重点会略微有些不同:
1 grid_search.best_params_
{'bootstrap': True,
 'max_depth': 12,
 'max_features': 'auto',
 'min_samples_leaf': 6,
 'min_samples_split': 3,
 'n_estimators': 900}
1 best_grid = grid_search.best_estimator_
2 evaluate(best_grid, test_features, test_labels)
平均气温误差. 3.6813587581120273
Accuracy = 93.78%.
看起来第二组选手要比第一组厉害一点,经过这一番折腾(去咖啡室将刚才泡的茶品完后回来再看。^_^)之后,可以把最终选定的所有参数都列出来,平均气温误差为3.66相当于到此最优的一个结果:
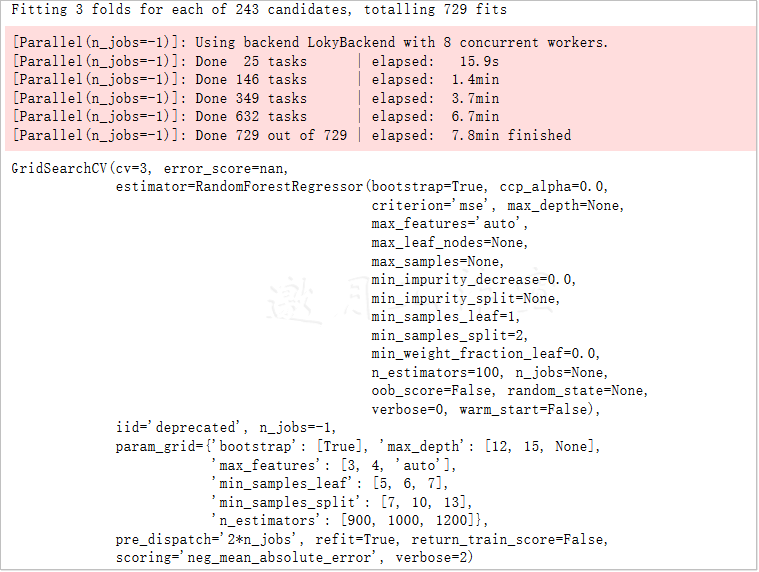
 1 param_grid = {
 2     'bootstrap': [True],
 3     'max_depth': [12, 15, None],
 4     'max_features': [3, 4,'auto'],
 5     'min_samples_leaf': [5, 6, 7],
 6     'min_samples_split': [7,10,13],
 7     'n_estimators': [900, 1000, 1200]
 8 }
 9
10 # 选择算法模型
11 rf = RandomForestRegressor()
12
13 # 继续寻找
14 grid_search_ad = GridSearchCV(estimator = rf, param_grid = param_grid,
15                            scoring = 'neg_mean_absolute_error', cv = 3,
16                            n_jobs = -1, verbose = 2)
17
18 grid_search_ad.fit(train_features, train_labels)
1 grid_search_ad.best_params_
grid_search_ad.best_params_

{'bootstrap': True,
 'max_depth': 12,
 'max_features': 4,
 'min_samples_leaf': 7,
 'min_samples_split': 13,
 'n_estimators': 1200}
1 best_grid_ad = grid_search_ad.best_estimator_
2 evaluate(best_grid_ad, test_features, test_labels)
平均气温误差. 3.6642196127491156
Accuracy = 93.82%.
1 print('最终模型参数:\n')
2 pprint(best_grid_ad.get_params())
最终模型参数:

{'bootstrap': True,
 'ccp_alpha': 0.0,
 'criterion': 'mse',
 'max_depth': 12,
 'max_features': 4,
 'max_leaf_nodes': None,
 'max_samples': None,
 'min_impurity_decrease': 0.0,
 'min_impurity_split': None,
 'min_samples_leaf': 7,
 'min_samples_split': 13,
 'min_weight_fraction_leaf': 0.0,
 'n_estimators': 1200,
 'n_jobs': None,
 'oob_score': False,
 'random_state': None,
 'verbose': 0,
 'warm_start': False}
上述输出结果中,不仅有刚才调整的参数,而且使用默认值的参数也一并显示出来,方便大家进行分析工作,最后总结一下机器学习中的调参任务。
- 1.参数空间是非常重要的,它会对结果产生决定性的影响,所以在任务开始之前,需要选择一个大致合适的区间,可以参考一些相同任务论文中的经验值。
- 2.随机搜索相对更节约时间,尤其是在任务开始阶段,并不知道参数在哪一个位置,效果可能更好时,可以把参数间隔设置得稍微大一些,用随机方法确定一个大致的位置。
- 3.网络搜索相当于地毯式搜索,需要遍历参数空间中每一种可能的组合,相对速度更慢,可以搭配随机搜索一起使用。
- 4.调参的方法还有很多,例如贝叶斯优化,这个还是很有意思的,跟大家简单说一下,试想之前的调参方式,是不是每一个都是独立地进行,不会对之后的结果产生任何影响?贝叶斯优化的基本思想在于,每一个优化都是在不断积累经验,这样会慢慢得到最终的解应当在的位置,相当于前一步结果会对后面产生影响,如果大家对贝叶斯优化感兴趣,可以参考Hyperopt工具包,用起来很简便:https://pypi.org/project/hyperopt/ 这是一份参考:https://www.jianshu.com/p/35eed1567463
令人不安的是这个安装会强制将networkX从2.4降为2.2,这是什么逆天逻辑?!各位慎重!
pip install hyperopt
/*
Looking in indexes: https://pypi.tuna.tsinghua.edu.cn/simple
...
Successfully built networkx
Installing collected packages: cloudpickle, networkx, tqdm, hyperopt
  Attempting uninstall: networkx
    Found existing installation: networkx 2.4
    Uninstalling networkx-2.4:
      Successfully uninstalled networkx-2.4
Successfully installed cloudpickle-1.3.0 hyperopt-0.2.3 networkx-2.2 tqdm-4.45.0
项目小结:
在基于随机森林的气温预测实战任务中,将整体模块分为3部分进行解读,首先讲解了基本随机森林模型构建与可视化方法。然后,对比数据量和特征个数对结果的影响,建议在任务开始阶段就尽可能多地选择数据特征和处理方案,方便后续进行对比实验和分析。最后,调参过程也是机器学习中必不可少的一部分,可以根据业务需求和实际数据量选择合适的策略。
第9章完。

