机器学习之模型评估与参数调优
一、流水线工作流
在利用训练数据对模型进行拟合时已经得到一些参数,使用流水线可以避免在将模型用于新数据时重新设置这些参数。利用sklearn中的Pipline类,使得我们可以拟合出包含任意多个处理步骤的模型,并将模型用于新数据的预测。
1.	# Title     : TODO
2.	# Objective : TODO
3.	# Created by: Chen Da
4.	# Created on: 2018/9/13
5.
6.	import pandas as pd
7.	import numpy as np
8.	import os,time,sys
9.
10.	#导入乳腺癌数据集
11.	df = pd.read_csv("https://archive.ics.uci.edu/ml/machine-learning-databases/breast-cancer-wisconsin/wdbc.data",header=None)
12.
13.	#构造特征矩阵和类别矩阵
14.	from sklearn.preprocessing import LabelEncoder
15.	X = df.loc[:, 2:].values
16.	y = df.loc[:, 1].values
17.	le = LabelEncoder()
18.	y = le.fit_transform(y)     #对类别进行编码
19.
20.	from sklearn.cross_validation import train_test_split
21.	X_train, X_test, y_train, y_test = train_test_split(X, y,
22.	                                                    test_size=0.2, random_state=0)
为了避免对训练集和测试集上的数据分别进行模型拟合、数据转换等操作,这里通过流水线将标准化、PCA和LR回归封装在一起。
1.	from sklearn.preprocessing import StandardScaler
2.	from sklearn.decomposition import PCA
3.	from sklearn.linear_model import LogisticRegression
4.	from sklearn.pipeline import Pipeline
5.
6.	pip_lr = Pipeline([('std', StandardScaler()),
7.	                   ('PCA', PCA(n_components=2)),
8.	                   ('LR', LogisticRegression(penalty='l1', random_state=0))])
9.
10.	pip_lr.fit(X_train, y_train)
11.	print("Test score is {}".format(pip_lr.score(X_test, y_test)))
12.
13.	Test score is 0.9385964912280702
二、k折交叉检验
通常情况下,我们将k折交叉验证用于模型的调 优,也就是找到使得模型泛化性能 最优的超参值。一旦找到了满意的超参值,我们就可以在全部的训练数据上重新训练模型, 并使用独立的测试数据集对模型性能做出最终评价。分层交叉检验是一种改进的方法,可以得到方差和偏差都较小的结果。
1.		from sklearn.cross_validation import StratifiedKFold    #分层k折交叉验证
2.
3.	kfold = StratifiedKFold(y=y_train,
4.	                        n_folds=10,
5.	                        random_state=0)
6.
7.	scores = []
8.
9.	for k, (train, test) in enumerate(kfold):
10.	    # print(k)
11.	    # print(train,test)
12.	    pip_lr.fit(X_train[train], y_train[train])
13.	    score = pip_lr.score(X_train[train], y_train[train])
14.	    scores.append(score)
15.	    print("Fold: {}; Class dist: {}; score: {}"
16.	          .format(k+1, np.bincount(y_train[train]), score))
17.
18.	print("CV score is %.3f +/- %.3f" % (np.mean(scores), np.std(scores)))
19.
20.
21.	Fold: 1; Class dist: [261 148]; score: 0.960880195599022
22.	Fold: 2; Class dist: [261 148]; score: 0.960880195599022
23.	Fold: 3; Class dist: [261 148]; score: 0.9633251833740831
24.	Fold: 4; Class dist: [261 148]; score: 0.960880195599022
25.	Fold: 5; Class dist: [261 148]; score: 0.9755501222493888
26.	Fold: 6; Class dist: [261 149]; score: 0.9658536585365853
27.	Fold: 7; Class dist: [261 149]; score: 0.9609756097560975
28.	Fold: 8; Class dist: [261 149]; score: 0.9658536585365853
29.	Fold: 9; Class dist: [261 149]; score: 0.9585365853658536
30.	Fold: 10; Class dist: [261 149]; score: 0.9609756097560975
31.
32.
33.	CV score is 0.963 +/- 0.005
Sklearn中也封装了k折交叉验证的API:
1.	from sklearn.cross_validation import cross_val_score
2.
3.	scores = cross_val_score(estimator=pip_lr,
4.	                         X=X_train,
5.	                         y=y_train,
6.	                         n_jobs=-1)
7.	print("CV score is %.3f +/- %.3f" % (np.mean(scores), np.std(scores)))
8.
9.	CV score is 0.954 +/- 0.014
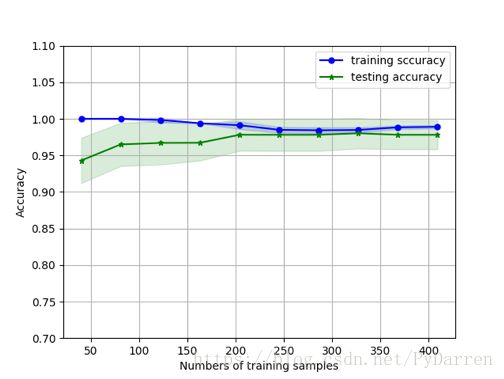
三、利用学习曲线判定方差和偏差
1.	import matplotlib.pyplot as plt
2.	from sklearn.learning_curve import learning_curve
3.
4.	pip_lr = Pipeline([('std', StandardScaler()),
5.	                   ('clf', LogisticRegression(
6.	                                penalty='l2',random_state=1))])
7.
8.	train_sizes,train_scores,test_scores = learning_curve(estimator=pip_lr,
9.	                                                      X=X_train,
10.	                                                      y=y_train,
11.	                                                      train_sizes=np.linspace(0.1,1,10),
12.	                                                      cv=10,
13.	                                                      n_jobs=-1)
14.
15.	# print(train_sizes,train_scores,test_scores)
16.
17.	train_mean = np.mean(train_scores,axis=1)
18.	train_std = np.std(train_scores,axis=1)
19.	test_mean = np.mean(test_scores,axis=1)
20.	test_std = np.std(test_scores,axis=1)
21.
22.	plt.plot(train_sizes,train_mean,
23.	         color='blue',marker='o',
24.	         markersize=5,
25.	         label='training sccuracy')
26.	plt.fill_between(train_sizes,
27.	                 train_mean + train_std,
28.	                 train_mean - train_std,
29.	                 alpha=0.15, color='blue')
30.	plt.plot(train_sizes, test_mean,
31.	         color='green',marker='*',
32.	         markersize=5,
33.	         label='testing accuracy')
34.	plt.fill_between(train_sizes,
35.	                 test_mean + test_std,
36.	                 test_mean - test_std,
37.	                 color='green',alpha=0.15)
38.	plt.grid()
39.	plt.xlabel('Numbers of training samples')
40.	plt.ylabel('Accuracy')
41.	plt.legend(loc='best')
42.	plt.ylim([0.7,1.1])
43.	plt.savefig('111.png')
44.	plt.show()
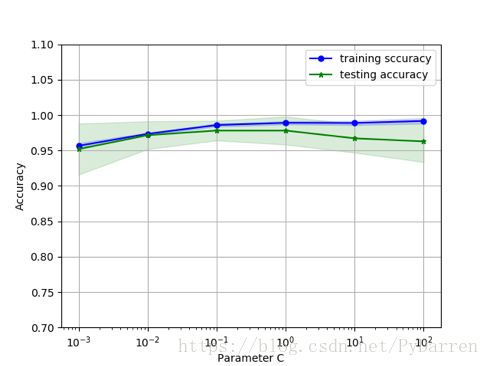
还可以通过验证曲线判定过拟合或者欠拟合来提高模型性能,与学习曲线不同的是,验证曲线绘制的不是样本大小与训练准确率、测试准确率之间的函数关系,而是准确率与模型参数之间的关系。
1.	from sklearn.learning_curve import validation_curve
2.
3.	param_range = [0.001,0.01,0.1,1,10,100]
4.	train_scores, test_scores = validation_curve(estimator=pip_lr,
5.	                                             X=X_train,
6.	                                             y=y_train,
7.	                                             param_name='clf__C',
8.	                                             param_range=param_range,
9.	                                             cv=10)  	#这里调整的是LR中的正则系数
10.	train_mean = np.mean(train_scores,axis=1)
11.	train_std = np.std(train_scores,axis=1)
12.	test_mean = np.mean(test_scores,axis=1)
13.	test_std = np.std(test_scores,axis=1)
14.
15.	plt.plot(param_range,train_mean,
16.	         color='blue',marker='o',
17.	         markersize=5,
18.	         label='training sccuracy')
19.	plt.fill_between(param_range,
20.	                 train_mean + train_std,
21.	                 train_mean - train_std,
22.	                 alpha=0.15, color='blue')
23.	plt.plot(param_range, test_mean,
24.	         color='green',marker='*',
25.	         markersize=5,
26.	         label='testing accuracy')
27.	plt.fill_between(param_range,
28.	                 test_mean + test_std,
29.	                 test_mean - test_std,
30.	                 color='green',alpha=0.15)
31.	plt.grid()
32.	plt.xscale('log')   #x坐标轴刻度按对数取
33.	plt.xlabel('Parameter C')
34.	plt.ylabel('Accuracy')
35.	plt.legend(loc='best')
36.	plt.ylim([0.7,1.1])
37.	plt.savefig('222.png')
38.	plt.show()
关于调优超参的方法常用的还有网格搜索(暴力穷举)、嵌套交叉验证。
四、其他常用的性能评价指标
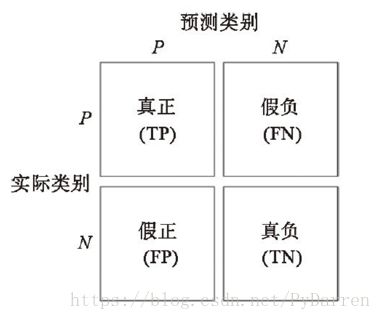
1、混肴矩阵
1.	#得到混肴矩阵
2.	from sklearn.metrics import confusion_matrix
3.	pip_lr.fit(X_train,y_train)
4.	y_pred = pip_lr.predict(X_test)
5.	confmat = confusion_matrix(y_true=y_test, y_pred=y_pred)
6.	print(confmat)
7.
8.	[[65  2]
9.	 [ 2 45]]
10.
11.	#得到真正率,召回率,f1分数
12.	from sklearn.metrics import precision_score, recall_score, f1_score
13.
14.	print("precision score is {}".format(precision_score(y_true=y_test, y_pred=y_pred)))
15.	print("recall score is {}".format(recall_score(y_true=y_test, y_pred=y_pred)))
16.	print("f1 score is {}".format(f1_score(y_true=y_test, y_pred=y_pred)))
17.
18.	precision score is 0.9574468085106383
19.	recall score is 0.9574468085106383
20.	f1 score is 0.9574468085106385
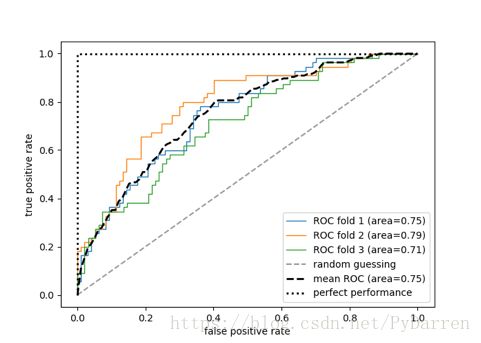
2、ROC曲线
这里给出的是真正率-假正率曲线,也可以绘制真正率-召回率曲线。
1.	from sklearn.metrics import roc_curve,auc
2.	from scipy import interp
3.
4.	X_train2 = X_train[:,[4,14]]
5.	cv = StratifiedKFold(y_train,
6.	                     n_folds=3,
7.	                     random_state=0)        #分层抽样
8.	fig = plt.figure(figsize=(7,5))
9.	mean_tpr = 0.0
10.	mean_fpr = np.linspace(0,1,100)
11.	all_tpr = []
12.
13.	for i, (train,test) in enumerate(cv):
14.	    probas = pip_lr.fit(X_train2[train],
15.	                        y_train[train]).predict_proba(X_train2[test])
16.	    # print(probas)
17.	    fpr,tpr,thresholds = roc_curve(y_train[test],
18.	                                   probas[:,1],
19.	                                   pos_label=1)
20.	    # print(fpr,tpr,thresholds)
21.	    mean_tpr += interp(mean_fpr,fpr,tpr)    #利用三个块数据对ROC曲线的内插均值进行计算
22.	    # print(mean_tpr)
23.	    mean_tpr[0] = 0.0
24.	    # print(mean_tpr)
25.	    roc_auc = auc(fpr,tpr)
26.	    plt.plot(fpr,
27.	             tpr,
28.	             lw=1,
29.	             label='ROC fold %d (area=%0.2f)'
30.	                    % (i+1,roc_auc))
31.	plt.plot([0,1],
32.	         [0,1],
33.	         linestyle='--',
34.	         color=(0.6,0.6,0.6),
35.	         label="random guessing")
36.	mean_tpr /= len(cv)
37.	mean_tpr[-1] = 1.0
38.	mean_auc = auc(mean_fpr,mean_tpr)
39.	plt.plot(mean_fpr,
40.	         mean_tpr,
41.	         'k--',
42.	         label='mean ROC (area=%0.2f)' % mean_auc,
43.	         lw=2)
44.	plt.plot([0,0,1],
45.	         [0,1,1],
46.	         lw=2,
47.	         linestyle=':',
48.	         color='black',
49.	         label='perfect performance')
50.	plt.xlim([-0.05,1.05])
51.	plt.ylim([-0.05,1.05])
52.	plt.xlabel('false positive rate')
53.	plt.ylabel('true positive rate')
54.	plt.legend(loc='best')
55.	plt.savefig('333.png')
56.	plt.show()


