简介
arcgis api for js 4+版本发布很久了,该版本代码风格符合现阶段主流的编码风格,相比3+版本的二次开发更具美感,同时兼容requireJs了(3+版本是和requireJs直接冲突的版本,要在项目中共同使用的最好方式是把地图应用单独放在iframe里面)(当然,打包方式需要用requireJs的打包而不能用dojo-builder的打包方式),然而估计这esri的团队都注重3d的开发了,所以对于3+版本原有的很多功能都还没有实现。比如3+版本的工具draw,官网给出的答案是会做,但具体做的时间是 comming soon,本人从4.0等到了4.2,这个东西还是没有,于是索性自己写了一个。其中该工具只支持2d的绘图。
使用方式

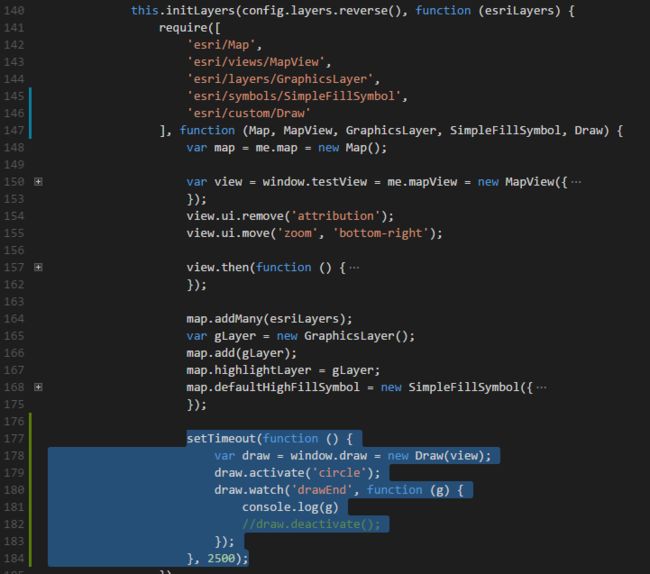
代码如下
`define([
"./Custom",
"../layers/GraphicsLayer",
"../geometry/Point",
"../geometry/Polyline",
"../geometry/Polygon",
"../geometry/Extent",
"../geometry/Circle",
"../Graphic",
"../symbols/SimpleMarkerSymbol",
"../symbols/SimpleLineSymbol",
"../symbols/SimpleFillSymbol",
"dojo/dom"], function (Custom, GraphicsLayer, Point,
Polyline, Polygon, Extent, Circle, Graphic, SimpleMarkerSymbol, SimpleLineSymbol,
SimpleFillSymbol, dom) {
    var types = {
        POLYGON: 'polygon',
        POLYLINE: 'polyline',
        POINT: 'point',
        CIRCLE: 'circle',
        FREE_POLYGON: 'free_polygon',
        FREE_POLYLINE: 'free_polyline',
        FREE_EXTENT: 'free_extent'
    };

    var Draw = Custom.createSubclass({
        declaredClass: "esri.custom._Draw",
        normalizeCtorArgs: function (view, options) {
            options || (options = {});
            this._mapView = view;
            this._clickPoints = []; // 点击绘制时的点集合
            this._tempGraphicLayer = new GraphicsLayer(); // 绘制过程中的要素图层
            this._drawGraphicLayer = new GraphicsLayer(); // 绘制完成的要素图层
            this._mapView.map.add(this._drawGraphicLayer);
            this._mapView.map.add(this._tempGraphicLayer);
            this._defaultSymbol = dojo.mixin({ // 默认样式
                polygon: new SimpleFillSymbol({ // 默认绘制polygon的样式
                    color: [127, 127, 127, 0.9],
                    style: "solid",
                    outline: {
                        color: [0, 124, 247, 1],
                        width: 2
                    }
                }),
                tempPolygon: new SimpleFillSymbol({ // 绘制过程中的polygon样式
                    color: [0, 0, 0, 0],
                    style: "solid",
                    outline: {
                        color: [0, 124, 247, 1],
                        width: 2
                    }
                }),
                polyline: new SimpleLineSymbol({
                    color: [0, 124, 247, 1],
                    width: 2,
                    style: "solid"
                }),
                tempPolyline: new SimpleLineSymbol({
                    color: [0, 124, 247, 1],
                    width: 2,
                    style: "solid"
                })
            }, options.defaultSymbol);
            dojo.query(view.container).addContent('');
            this.tooltipMsg = dojo.mixin({
                click: '点击开始绘制',
                doubleClick: '双击结束绘制',
                drag: '按下鼠标左键开始绘制',
                dragStart: '移动鼠标进行绘制',
                dragEnd: '松开鼠标左键结束绘制'
            }, options.tooltipMsg);
            this._tooltipNode = dom.byId('fn-tooltip-div');
        },
        _clickGeometryTypes: [types.POLYGON, types.POLYLINE, types.POINT, types.POINT], // 点击绘制的几何类型
        _dragGeometryTypes: [types.FREE_POLYGON, types.FREE_POLYLINE, types.FREE_EXTENT], // 拖拽绘制的几何类型
        properties: {
            start: false,
            end: null,
            pointermove: null,
            drag: null,
            click: null
        },
        _setTooltipMsg: function (msg) {
            if (msg) {
                this._tooltipNode.style.display = "block";
            } else {
                this._tooltipNode.style.display = "none";
            }
            this._tooltipNode.innerHTML = msg;
        },
        registerEvents: function () {
            var me = this;
            this._handlers = [this._mapView.on('click', function (event) { //
                if (dojo.indexOf(me._clickGeometryTypes, me._geometryType) > -1) {
                    if (!me.get('start')) {
                        me.set('start', true);
                        if (me._geometryType !== types.POINT)
                            me._setTooltipMsg(me.tooltipMsg.doubleClick);
                    }
                    //me._drawPoint(event.mapPoint);
                    me._clickPoints.push(event.mapPoint);
                    me._tempGraphicLayer.removeAll();
                    me._drawGraphicLayer.removeAll();
                    event.stopPropagation();
                    var graphic;
                    switch (me._geometryType) {
                        case types.POLYGON:
                            graphic = me._drawPolygon(me._clickPoints); break;
                        case types.POLYLINE:
                            graphic = me._drawPolyline(me._clickPoints); break;
                        case types.POINT:
                            graphic = me._drawPoint(event.mapPoint);
                            me._endDraw(graphic);
                        case types.CIRCLE:
                            graphic = me._drawCircle(me._clickPoints);
                            if (me._clickPoints.length === 2) {
                                me._endDraw(graphic);
                            }
                    }
                    if (graphic) {
                        graphic.mapPoint = event.mapPoint;
                        me.set('click', graphic);
                    } else {
                        me.set('click', { mapPoint: event.mapPoint });
                    }
                }
            }), this._mapView.on('pointer-move', this.debounce(function (event) {
                var graphic = me._dragOrMoveHandler(event);
                if (graphic) {
                    me.set('pointermove', graphic);
                }
            }, 0)), this._mapView.on('double-click', function (event) {
                if (me.get('start')) {
                    event.stopPropagation();
                    me._clickPoints.push(event.mapPoint);
                    me._tempGraphicLayer.removeAll();
                    var graphic = me._generateGraphic();
                    graphic.mapPoint = event.mapPoint;
                    me._endDraw(graphic);
                }
            }), this._mapView.on('pointer-down', function (event) {
                if (dojo.indexOf(me._dragGeometryTypes, me._geometryType) > -1) {
                    if (!me.get('start')) {
                        me.set('start', true);
                        me._setTooltipMsg(me.tooltipMsg.dragStart);
                    }
                }
            }), this._mapView.on('pointer-up', function (event) {
                if (dojo.indexOf(me._dragGeometryTypes, me._geometryType) > -1) {
                    var graphic = me._generateGraphic();
                    me._endDraw(graphic);
                }
            }), this._mapView.on('drag', function (event) {
                var graphic = me._dragOrMoveHandler(event);
                if (graphic) {
                    me.set('drag', graphic);
                }
            })];
        },
        _generateGraphic: function () {
            switch (this._geometryType) {
                case types.POLYGON:
                    return this._drawPolygon(this._clickPoints);
                case types.POLYLINE:
                    return this._drawPolyline(this._clickPoints);
            }
            return null;
        },
        _dragOrMoveHandler: function (event) {
            var node = this._tooltipNode, me = this, graphic;
            node.style.left = (event.x + 15) + 'px';
            node.style.top = (event.y - 25) + 'px';
            if (me.get('start')) {
                var mapPoint = me._mapView.toMap({ x: event.x, y: event.y });
                me._tempGraphicLayer.removeAll();
                switch (me._geometryType) {
                    case types.POLYGON:
                        graphic = me._drawPolygon(me._clickPoints.concat([mapPoint]), me._tempGraphicLayer); break;
                    case types.POLYLINE:
                        graphic = me._drawPolyline(me._clickPoints.concat([mapPoint]), me._tempGraphicLayer); break;
                    case types.Circle:
                        graphic = me._drawCircle(me._clickPoints.concat([mapPoint]), me._tempGraphicLayer); break;
                    case types.FREE_POLYGON:
                        me._freeDraw(event);
                        graphic = me._drawPolygon(me._clickPoints); break;
                    case types.FREE_POLYLINE:
                        me._freeDraw(event);
                        graphic = me._drawPolyline(me._clickPoints); break;
                    case types.FREE_EXTENT:
                        me._freeDraw(event);
                        graphic = me._drawExtent(me._clickPoints); break;
                }
            } else {
                if (me._geometryType.indexOf('free') > -1) {
                    me._setTooltipMsg(me.tooltipMsg.drag);
                } else {
                    me._setTooltipMsg(me.tooltipMsg.click);
                }
            }
            return graphic;
        },
        _freeDraw: function (event) {
            var me = this;
            event.stopPropagation();
            var mapPoint = me._mapView.toMap({ x: event.x, y: event.y });
            me._setTooltipMsg(me.tooltipMsg.dragEnd);
            me._clickPoints.push(mapPoint);
            me._drawGraphicLayer.removeAll();
        },
        _endDraw: function (graphic) {
            this.set('start', false);
            this.set('end', graphic);
            this._drawGraphicLayer.removeAll();
            this._clickPoints = [];
        },
        activate: function (geometryType) {
            this._geometryType = geometryType;
            this.registerEvents();
        },
        deactivate: function () {
            dojo.forEach(this._handlers, function (handler) {
                handler.remove();
            });
            this._tempGraphicLayer.removeAll();
            this._drawGraphicLayer.removeAll();
            this._setTooltipMsg('');
        },
        _drawCircle: function (mapPoints, layer) {
            var _layer = layer || this._drawGraphicLayer;
            if (mapPoints.length === 1) {
                this._drawPoint(mapPoints[0]);
            }
            else if (mapPoints.length === 2) {
                this._drawPolyline(mapPoints, layer);
                var firstPoint = mapPoints[0];
                var secPoint = mapPoints[mapPoints.length - 1];
                var circle = new Circle({
                    spatialReference: this._mapView.spatialReference,
                    center: firstPoint,
                    radius: Math.sqrt(Math.pow(firstPoint.x - secPoint.x, 2) + Math.pow(firstPoint.y - secPoint.y, 2))
                });
                var graphic = new Graphic({
                    geometry: circle,
                    symbol: layer ? this._defaultSymbol.tempPolygon : this._defaultSymbol.polygon
                });
                _layer.add(graphic);
                this._drawPoint(circle.centroid);
                return graphic;
            }
        },
        _drawExtent: function (mapPoints, layer) {
            var _layer = layer || this._drawGraphicLayer;
            if (mapPoints.length >= 2) {
                var firstPoint = mapPoints[0];
                var secPoint = mapPoints[mapPoints.length - 1];
                var extent = new Extent({
                    spatialReference: this._mapView.spatialReference,
                    xmax: Math.max(firstPoint.x, secPoint.x),
                    xmin: Math.min(firstPoint.x, secPoint.x),
                    ymax: Math.max(firstPoint.y, secPoint.y),
                    ymin: Math.min(firstPoint.y, secPoint.y)
                });
                var graphic = new Graphic({
                    geometry: extent,
                    symbol: layer ? this._defaultSymbol.tempPolygon : this._defaultSymbol.polygon
                });
                _layer.add(graphic);
                return graphic;
            }
        },
        _drawPolygon: function (mapPoints, layer) {
            var _layer = layer || this._drawGraphicLayer;
            if (mapPoints.length === 2) {
                this._drawPolyline(mapPoints, layer);
            } else if (mapPoints.length > 2) {
                var polygon = new Polygon({
                    spatialReference: this._mapView.spatialReference,
                    rings: [dojo.map(mapPoints, function (mapPoint) {
                        return [mapPoint.x, mapPoint.y];
                    })]
                });
                var graphic = new Graphic({
                    geometry: polygon,
                    symbol: layer ? this._defaultSymbol.tempPolygon : this._defaultSymbol.polygon
                });
                _layer.add(graphic);
                this._drawPoint(polygon.centroid);
                console.log(polygon.centroid)
                return graphic;
            }
        },
        _drawPolyline: function (mapPoints, layer) {
            var _layer = layer || this._drawGraphicLayer;
            var polyline = new Polyline({
                spatialReference: this._mapView.spatialReference,
                paths: [dojo.map(mapPoints, function (mapPoint) {
                    return [mapPoint.x, mapPoint.y];
                })]
            });
            var graphic = new Graphic({
                geometry: polyline,
                symbol: layer ? this._defaultSymbol.tempPolyline : this._defaultSymbol.polyline
            });
            _layer.add(graphic);
            return graphic;
        },
        _drawPoint: function (mapPoint, layer) {
            var _layer = layer || this._drawGraphicLayer;
            var mp = new Point({
                spatialReference: mapPoint.spatialReference || this._mapView.spatialReference,
                x: mapPoint.x,
                y: mapPoint.y
            });
            var graphic = new Graphic({
                geometry: mp,
                symbol: new SimpleMarkerSymbol()
            });
            _layer.add(graphic);
            return graphic;
        }
    });

    Draw.TYPE = types;

    return Draw;

});
效果图

小姐
未经过祥测,也许有bug