【Opencv】opencv-python学习笔记代码复现(图像金字塔,轮廓检测,直方图)
opencv-python学习笔记代码复现(图像金字塔,轮廓检测,直方图)
- 图像金字塔
- 高斯金字塔
- 拉普拉斯金字塔
- 轮廓检测
- 绘制轮廓
- 轮廓近似
- 模板匹配
- opencv模板匹配----单目标匹配
- opencv模板匹配----多目标匹配
- 直方图
- 绘制图像直方图【是什么】
- 绘制灰度图直方图
- 绘制彩图直方图【分通道】
- mask操作
- 直方图均衡化
- 自适应直方图均衡化
- 傅里叶变换
- 高通滤波
图像金字塔
高斯金字塔
#金字塔
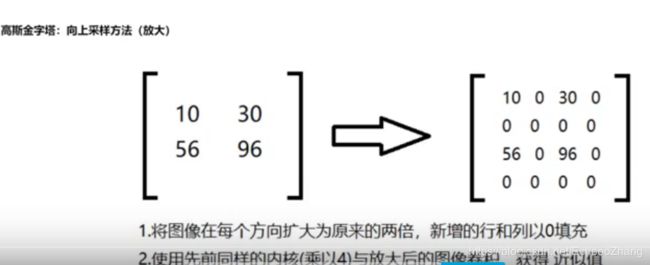
# 高斯金字塔(向上【放大】,向下【缩小】)
img=getimg('d:/wall.jpg',0)
up=cv2.pyrUp(img)
down=cv2.pyrDown(img)
cvshow(img)
cvshow(up)
cvshow(down)
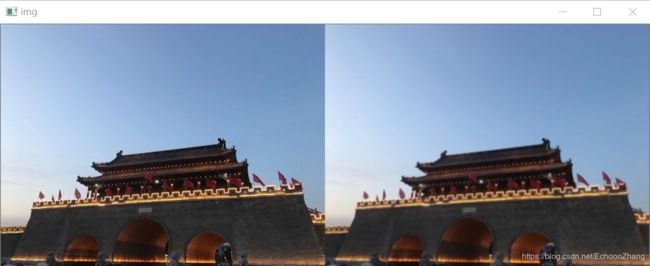
原图:
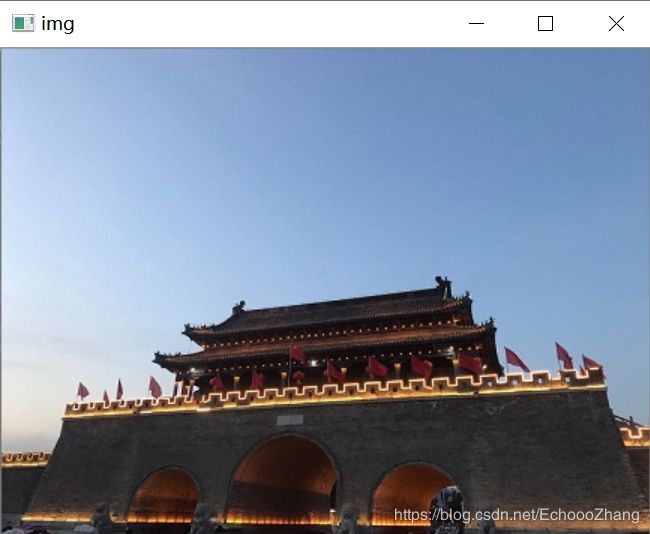
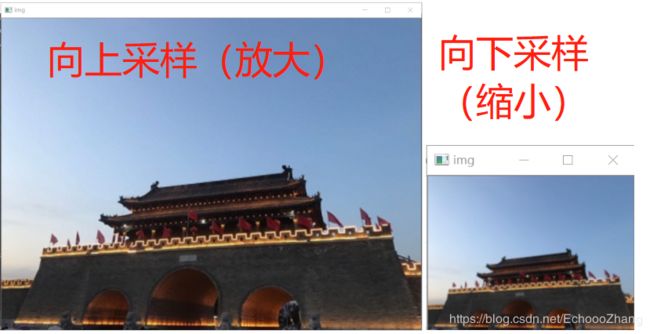
先up后down后【右】或者先down后Up后,虽然尺寸同原图,但是与原图【左】不同,不清晰。
up_1=cv2.pyrUp(img)
updown=cv2.pyrDown(up_1)
res=np.hstack((img,updown))
cvshow(res)
拉普拉斯金字塔
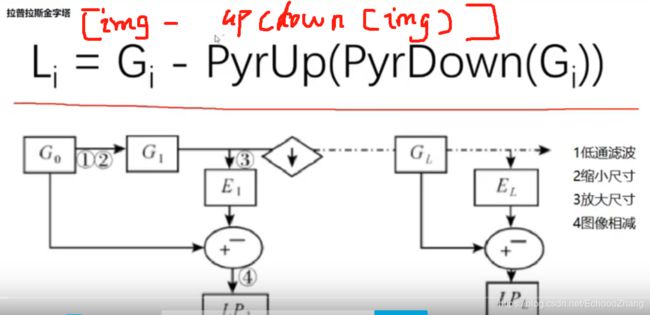
# 拉普拉斯金字塔 原图-(up(down(原图)))
down=cv2.pyrDown(img)
downup=cv2.pyrUp(down)
#拉普拉斯金字塔结果
img_l=img-downup
res=np.hstack((img,img_l))
cvshow(res)
轮廓检测
绘制轮廓
# 图像轮廓
# 为了更好的效果,使用二值图像
# 需要注意的是cv2.findContours()函数接受的参数为二值图,即黑白的(不是灰度图),所以读取的图像要先转成灰度的
# cv2.findContours()函数返回两个值,一个是轮廓本身contours(一个list,list中每个元素都是图像中的一个轮廓), 还有一个是每条轮廓对应的属性。
img=getimg('d:/hl.jpg',0)
gray=getimg('d:/hl.jpg',2)
ret,thresh=cv2.threshold(gray,127,255,cv2.THRESH_BINARY)
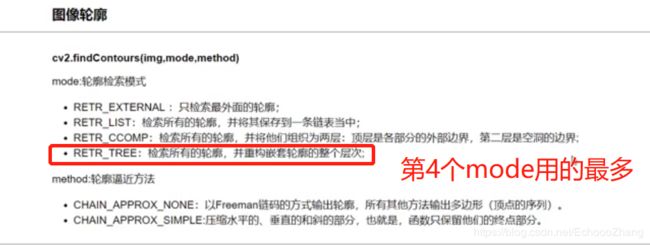
contours,hierarchy=cv2.findContours(thresh,cv2.RETR_TREE,cv2.CHAIN_APPROX_NONE)
# 绘制轮廓
# 需要先复制图像,否则原图会被修改
# drawContours(传入绘制图像,轮廓,轮廓索引(-1是全部轮廓都要),颜色模式,线条厚度)
draw_img=img.copy()
res=cv2.drawContours(draw_img,contours,-1,(0,0,255),2)
cvshow(res)
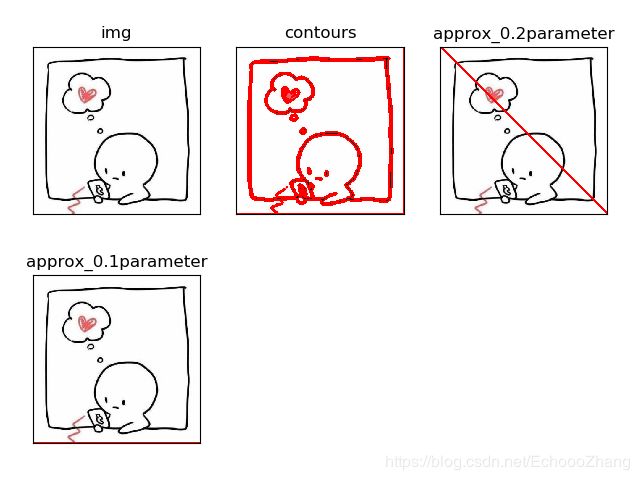
轮廓近似
# 轮廓近似
img=getimg('d:/9.jpg',1)
gray=getimg('d:/9.jpg',2)
ret,thresh=cv2.threshold(gray,127,255,cv2.THRESH_BINARY)
contours,hierarchy=cv2.findContours(thresh,cv2.RETR_TREE,cv2.CHAIN_APPROX_NONE)
cnt=contours[0]
draw_img1=img.copy()
# res3=cv2.drawContours(draw_img1,[cnt],-1,(0,0,255),2)
res3=cv2.drawContours(draw_img1,contours,-1,(255,0,0),4)

# 设置一个用于近似衡量值,系数乘以轮廓的周长
epsilon=0.2*cv2.arcLength(cnt,True)
approx=cv2.approxPolyDP(cnt,epsilon,True)
draw_img2=img.copy()
res4=cv2.drawContours(draw_img2,[approx],-1,(255,0,0),4)

epsilon1=0.1*cv2.arcLength(cnt,True)
approx1=cv2.approxPolyDP(cnt,epsilon1,True)
draw_img3=img.copy()
res5=cv2.drawContours(draw_img3,[approx1],-1,(255,0,0),4)

#显示图,pltshow是自己写的函数
imgs=[img,res3,res4,res5]
titles=['img','contours','approx_0.2parameter','approx_0.1parameter']
pltshow(imgs,titles)
模板匹配
opencv模板匹配----单目标匹配
#opencv模板匹配----单目标匹配
#读取目标图片
target = cv2.imread("d:/tf.jpg")
#读取模板图片
template = cv2.imread("d:/qx.jpg")
#获得模板图片的高宽尺寸
print(template.shape)
theight, twidth = template.shape[:2]
#执行模板匹配,采用的匹配方式cv2.TM_SQDIFF_NORMED
result = cv2.matchTemplate(target,template,cv2.TM_SQDIFF_NORMED)
#归一化处理
cv2.normalize( result, result, 0, 1, cv2.NORM_MINMAX, -1 )
#寻找矩阵(一维数组当做向量,用Mat定义)中的最大值和最小值的匹配结果及其位置
min_val, max_val, min_loc, max_loc = cv2.minMaxLoc(result)
#匹配值转换为字符串
#对于cv2.TM_SQDIFF及cv2.TM_SQDIFF_NORMED方法min_val越趋近与0匹配度越好,匹配位置取min_loc
#对于其他方法max_val越趋近于1匹配度越好,匹配位置取max_loc
strmin_val = str(min_val)
#绘制矩形边框,将匹配区域标注出来
#min_loc:矩形定点
#(min_loc[0]+twidth,min_loc[1]+theight):矩形的宽高
#(0,0,225):矩形的边框颜色;2:矩形边框宽度
cv2.rectangle(target,min_loc,(min_loc[0]+twidth,min_loc[1]+theight),(0,0,225),2)
#显示结果,并将匹配值显示在标题栏上
cv2.imshow("MatchResult----MatchingValue="+strmin_val,target)
cv2.waitKey()
cv2.destroyAllWindows()
opencv模板匹配----多目标匹配
#opencv模板匹配----多目标匹配
import cv2
import numpy
#读取目标图片
target = cv2.imread("d:/tf2.jpg")
#读取模板图片
template = cv2.imread("d:/qx.jpg")
#获得模板图片的高宽尺寸
theight, twidth = template.shape[:2]
#执行模板匹配,采用的匹配方式cv2.TM_SQDIFF_NORMED
result = cv2.matchTemplate(target,template,cv2.TM_SQDIFF_NORMED)
#归一化处理
#cv2.normalize( result, result, 0, 1, cv2.NORM_MINMAX, -1 )
#寻找矩阵(一维数组当做向量,用Mat定义)中的最大值和最小值的匹配结果及其位置
min_val, max_val, min_loc, max_loc = cv2.minMaxLoc(result)
#绘制矩形边框,将匹配区域标注出来
#min_loc:矩形定点
#(min_loc[0]+twidth,min_loc[1]+theight):矩形的宽高
#(0,0,225):矩形的边框颜色;2:矩形边框宽度
cv2.rectangle(target,min_loc,(min_loc[0]+twidth,min_loc[1]+theight),(0,0,225),2)
#匹配值转换为字符串
#对于cv2.TM_SQDIFF及cv2.TM_SQDIFF_NORMED方法min_val越趋近与0匹配度越好,匹配位置取min_loc
#对于其他方法max_val越趋近于1匹配度越好,匹配位置取max_loc
strmin_val = str(min_val)
#初始化位置参数
temp_loc = min_loc
other_loc = min_loc
numOfloc = 1
#第一次筛选----规定匹配阈值,将满足阈值的从result中提取出来
#对于cv2.TM_SQDIFF及cv2.TM_SQDIFF_NORMED方法设置匹配阈值为0.01
threshold = 0.01
loc = numpy.where(result<threshold)
#遍历提取出来的位置
for other_loc in zip(*loc[::-1]):
    #第二次筛选----将位置偏移小于5个像素的结果舍去
    if (temp_loc[0]+5<other_loc[0])or(temp_loc[1]+5<other_loc[1]):
        numOfloc = numOfloc + 1
        temp_loc = other_loc
        cv2.rectangle(target,other_loc,(other_loc[0]+twidth,other_loc[1]+theight),(0,0,225),2)
str_numOfloc = str(numOfloc)
#显示结果,并将匹配值显示在标题栏上
strText = "MatchResult----MatchingValue="+strmin_val+"----NumberOfPosition="+str_numOfloc
cv2.imshow(strText,target)
cv2.waitKey()
cv2.destroyAllWindow
直方图
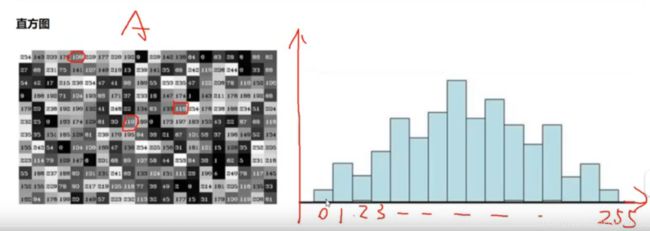
绘制图像直方图【是什么】
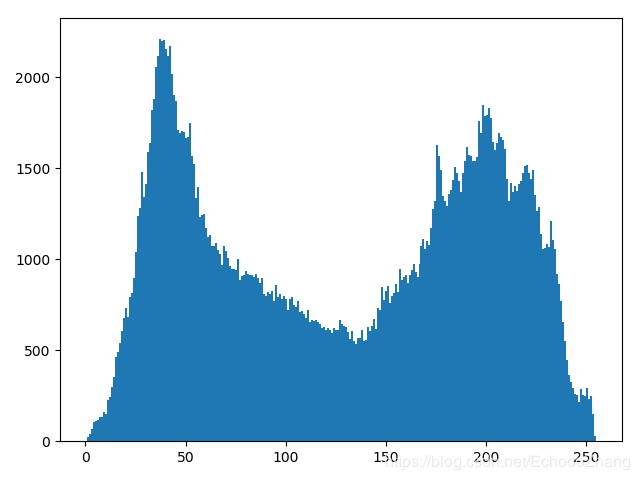
绘制灰度图直方图
# 灰度图直方图
gray=getimg('d:/hl.jpg',2)
hist=cv2.calcHist([gray],[0],None,[256],[0,256])
plt.hist(gray.ravel(),256)
plt.show()
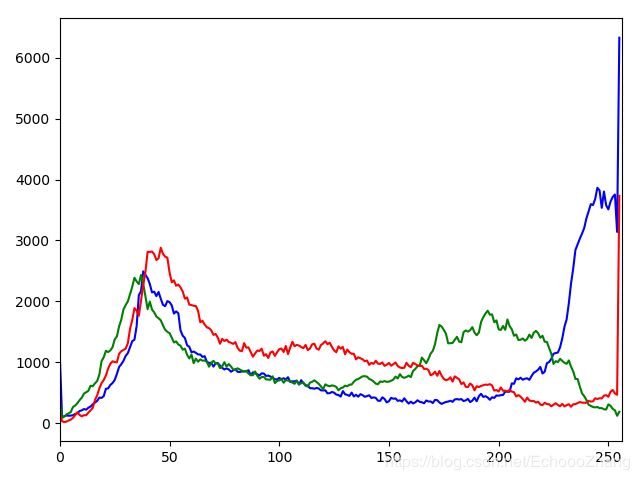
绘制彩图直方图【分通道】
# 彩色图像直方图
img=getimg('d:/hl.jpg',0)
color=('b','g','r')
for i,col in enumerate(color):
    histr=cv2.calcHist([img],[i],None,[256],[0,256])
    plt.plot(histr,color=col)
    plt.xlim([0,256])
plt.show()
mask操作
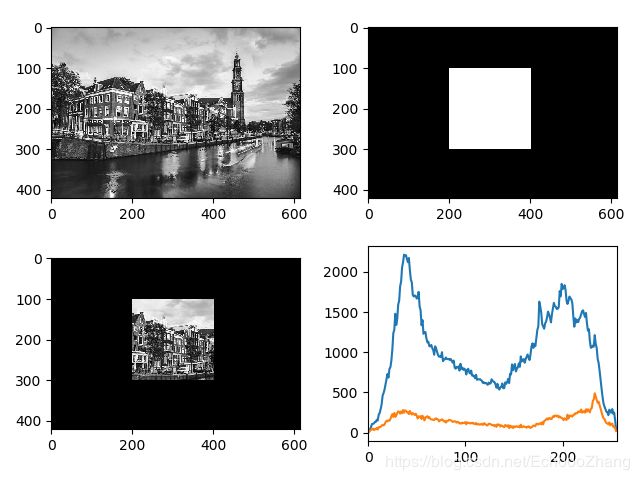
对图片中某区域进行直方图绘制,mask是制造一个区域与原图进行与操作,即可将某块区域的图片显示。【左上:原图灰度,右上:mask,左下:masked后的区域,右下:显示原图直方图和图中选中区域的直方图】
# mask操作
# 创建mask
img=getimg('d:/hl.jpg',2)
print(img.shape)
mask=np.zeros(img.shape[:2],np.uint8)
mask[100:300,200:400]=255
masked_img=cv2.bitwise_and(img,img,mask=mask)
hist_full=cv2.calcHist([img],[0],None,[256],[0,256])
hist_mask=cv2.calcHist([img],[0],mask,[256],[0,256])
plt.subplot(221),plt.imshow(img,'gray')
plt.subplot(222),plt.imshow(mask,'gray')
plt.subplot(223),plt.imshow(masked_img,'gray')
plt.subplot(224),plt.plot(hist_full),plt.plot(hist_mask)
plt.xlim([0,256])
plt.show()
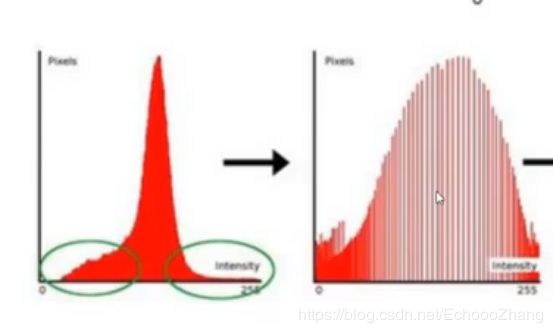
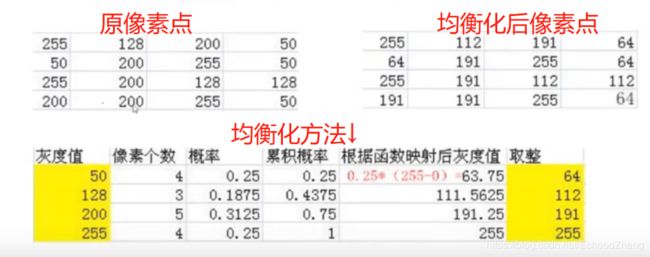
直方图均衡化
# 直方图均衡化
img=getimg('d:/hl.jpg',2)
equ=cv2.equalizeHist(img)
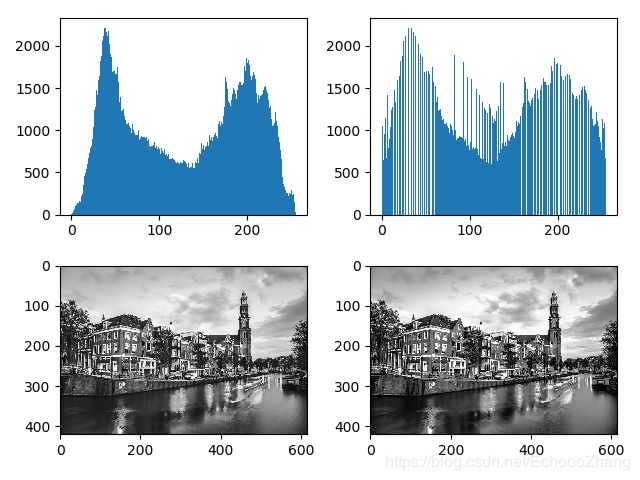
# 原直方图【左上】
plt.subplot(221),plt.hist(img.ravel(),256)
# 均衡化后直方图【右上】
plt.subplot(222),plt.hist(equ.ravel(),256)
# 原图【左下】
plt.subplot(223),plt.imshow(img,'gray')
# 均衡化后图【右下】
plt.subplot(224),plt.imshow(equ,'gray')
plt.show()
自适应直方图均衡化
为了避免有些亮的区域均衡化后看不清,可采取自适应均衡化(貌似更清晰一点)
# 自适应直方图均衡化
img=getimg('d:/wall.jpg',2)
equ=cv2.equalizeHist(img)
# 自适应均衡
clahe=cv2.createCLAHE(clipLimit=2.0,tileGridSize=(8,8))
res_clache=clahe.apply(img)
res=np.hstack((img,equ,res_clache))
cvshow(res)
傅里叶变换
【没咋看,就简单实验一下,等需要用到再补充】
高通滤波
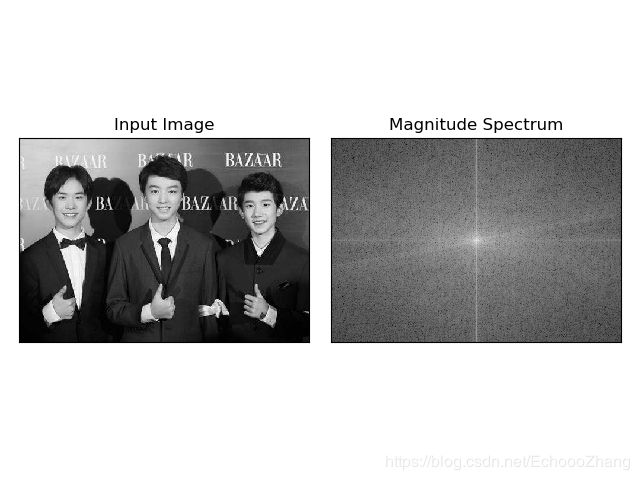
# 高通滤波
import numpy as np
import cv2
from matplotlib import pyplot as plt

img = cv2.imread('d:/tf.jpg',0)

dft = cv2.dft(np.float32(img),flags = cv2.DFT_COMPLEX_OUTPUT)
dft_shift = np.fft.fftshift(dft)

magnitude_spectrum = 20*np.log(cv2.magnitude(dft_shift[:,:,0],dft_shift[:,:,1]))

plt.subplot(121),plt.imshow(img, cmap = 'gray')
plt.title('Input Image'), plt.xticks([]), plt.yticks([])
plt.subplot(122),plt.imshow(magnitude_spectrum, cmap = 'gray')
plt.title('Magnitude Spectrum'), plt.xticks([]), plt.yticks([])
plt.show()

