Elasticsearch集群配置方法
Elasticsearch集群应用于ELK:
第一步:做3台Elasticsearch集群:
es1(192.168.0.115)/es2(192.168.0.116)/es3(192.168.0.117)
[root@es1 elasticsearch]# netstat -tulnp | grep 92
tcp6 0 0 192.168.0.115:9200 :::* LISTEN 9852/java
tcp6 0 0 192.168.0.115:9300 :::* LISTEN 9852/java
[root@es1 elasticsearch]# curl 192.168.0.115:9200/_cat/master?v
id host ip node
JAD96f98RKWPhSEszbGSvw 192.168.0.116 192.168.0.116 es2
[root@es1 elasticsearch]# curl -XGET 192.168.0.115:9200/_cluster/health?pretty
{
"cluster_name" : "es-cluster",
"status" : "green",
"timed_out" : false,
"number_of_nodes" : 3,
"number_of_data_nodes" : 3,
"active_primary_shards" : 0,
"active_shards" : 0,
"relocating_shards" : 0,
"initializing_shards" : 0,
"unassigned_shards" : 0,
"delayed_unassigned_shards" : 0,
"number_of_pending_tasks" : 0,
"number_of_in_flight_fetch" : 0,
"task_max_waiting_in_queue_millis" : 0,
"active_shards_percent_as_number" : 100.0
}
[root@es1 elasticsearch]# curl -XGET 'http://192.168.0.115:9200/_cat/nodes?pretty'
192.168.0.117 9 96 2 0.04 0.15 0.13 mdi - es3
192.168.0.116 8 95 3 0.02 0.09 0.07 mdi * es2
192.168.0.115 8 96 4 0.02 0.10 0.08 mdi – es1
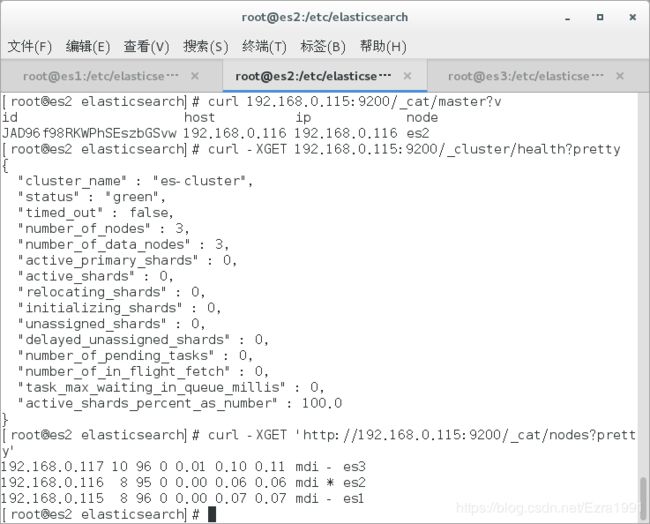
[root@es2 elasticsearch]# curl 192.168.0.115:9200/_cat/master?v
id host ip node
JAD96f98RKWPhSEszbGSvw 192.168.0.116 192.168.0.116 es2
[root@es2 elasticsearch]# curl -XGET 192.168.0.115:9200/_cluster/health?pretty
{
"cluster_name" : "es-cluster",
"status" : "green",
"timed_out" : false,
"number_of_nodes" : 3,
"number_of_data_nodes" : 3,
"active_primary_shards" : 0,
"active_shards" : 0,
"relocating_shards" : 0,
"initializing_shards" : 0,
"unassigned_shards" : 0,
"delayed_unassigned_shards" : 0,
"number_of_pending_tasks" : 0,
"number_of_in_flight_fetch" : 0,
"task_max_waiting_in_queue_millis" : 0,
"active_shards_percent_as_number" : 100.0
}
[root@es2 elasticsearch]# curl -XGET 'http://192.168.0.115:9200/_cat/nodes?pretty'
192.168.0.117 10 96 0 0.01 0.10 0.11 mdi - es3
192.168.0.116 8 95 0 0.00 0.06 0.06 mdi * es2
192.168.0.115 8 96 0 0.00 0.07 0.07 mdi – es1
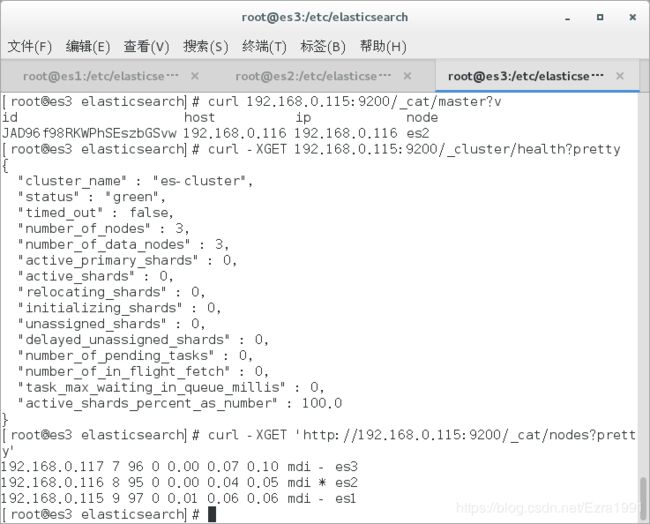
[root@es3 elasticsearch]# curl 192.168.0.115:9200/_cat/master?v
id host ip node
JAD96f98RKWPhSEszbGSvw 192.168.0.116 192.168.0.116 es2
[root@es3 elasticsearch]# curl -XGET 192.168.0.115:9200/_cluster/health?pretty
{
"cluster_name" : "es-cluster",
"status" : "green",
"timed_out" : false,
"number_of_nodes" : 3,
"number_of_data_nodes" : 3,
"active_primary_shards" : 0,
"active_shards" : 0,
"relocating_shards" : 0,
"initializing_shards" : 0,
"unassigned_shards" : 0,
"delayed_unassigned_shards" : 0,
"number_of_pending_tasks" : 0,
"number_of_in_flight_fetch" : 0,
"task_max_waiting_in_queue_millis" : 0,
"active_shards_percent_as_number" : 100.0
}
[root@es3 elasticsearch]# curl -XGET 'http://192.168.0.115:9200/_cat/nodes?pretty'
192.168.0.117 7 96 0 0.00 0.07 0.10 mdi - es3
192.168.0.116 8 95 0 0.00 0.04 0.05 mdi * es2
192.168.0.115 9 97 0 0.01 0.06 0.06 mdi – es1
第二部:将集群应用到ELK:
根据官网介绍,Logstash端可以一次性指定多台Elasticsearch主机。但是在Kibana端,需要建立一台只单纯负责负载均衡的Elasticsearch主机(192.168.0.114)加入集群,该主机并不搜索、存储数据,只负责调度集群内其他主机。
If you have multiple nodes in your Elasticsearch cluster, the easiest way to distribute Kibana requests across the nodes is to run an Elasticsearch Coordinating only node on the same machine as Kibana. Elasticsearch Coordinating only nodes are essentially smart load balancers that are part of the cluster. They process incoming HTTP requests, redirect operations to the other nodes in the cluster as needed, and gather and return the results. For more information, see Node in the Elasticsearch reference.
To use a local client node to load balance Kibana requests:
-
Install Elasticsearch on the same machine as Kibana.
-
Configure the node as a Coordinating only node. In
elasticsearch.yml, setnode.data,node.masterandnode.ingesttofalse:# 3. You want this node to be neither master nor data node nor ingest node, but # to act as a "search load balancer" (fetching data from nodes, # aggregating results, etc.) # node.master: false node.data: false node.ingest: false# to act as a "search load balancer" (fetching data from nodes, # aggregating results, etc.) # node.master: false node.data: false node.ingest: false -
Configure the client node to join your Elasticsearch cluster. In
elasticsearch.yml, set thecluster.nameto the name of your cluster.cluster.name: "my_cluster" -
Check your transport and HTTP host configs in
elasticsearch.ymlundernetwork.hostandtransport.host. Thetransport.hostneeds to be on the network reachable to the cluster members, thenetwork.hostis the network for the HTTP connection for Kibana (localhost:9200 by default).network.host: localhost http.port: 9200 # by default transport.host refers to network.host transport.host:http.port: 9200 # by default transport.host refers to network.host transport.host:transport.tcp.port: 9300 - 9400 transport.tcp.port: 9300 - 9400 -
Make sure Kibana is configured to point to your local client node. In
kibana.yml, theelasticsearch.urlshould be set tolocalhost:9200.# The Elasticsearch instance to use for all your queries. elasticsearch.url: "http://localhost:9200"elasticsearch.url: "http://localhost:9200"
Logstash(192.168.0.112)
[root@logstash conf.d]# vim test1.conf
input {
file{
start_position => "beginning"
path => ["/var/log/messages"]
type => "message"
}
}
output {
if [type] == "message"{
elasticsearch{
hosts => ["192.168.0.115", "192.168.0.116", "192.168.0.117", "192.168.0.114"]
index => "messages-%{+YYYY.MM.dd}"
}
}
}
Kibana/Elasticsearch(192.168.0.114):
[root@kibana elasticsearch]# vim elasticsearch.yml
17 cluster.name: es-cluster
23 node.name: es4
55 network.host: 192.168.0.114
59 http.port: 9200
68 discovery.zen.ping.unicast.hosts: ["192.168.0.115", "192.168.0.116", "192.168.0.117", "192.168.0.114"]
72 discovery.zen.minimum_master_nodes: 2
75 node.master: false
76 node.data: false
77 node.ingest: false
[root@kibana ~]# vim /etc/kibana/kibana.yml
21 elasticsearch.url: "http://192.168.0.114:9200"
es-4/kibana (192.168.0.114)
[root@kibana ~]# curl 192.168.0.114:9200/_cat/master?v
id host ip node
JAD96f98RKWPhSEszbGSvw 192.168.0.116 192.168.0.116 es2
[root@kibana ~]# curl -XGET 192.168.0.114:9200/_cluster/health?pretty
{
"cluster_name" : "es-cluster",
"status" : "green",
"timed_out" : false,
"number_of_nodes" : 4,
"number_of_data_nodes" : 3,
"active_primary_shards" : 6,
"active_shards" : 12,
"relocating_shards" : 0,
"initializing_shards" : 0,
"unassigned_shards" : 0,
"delayed_unassigned_shards" : 0,
"number_of_pending_tasks" : 0,
"number_of_in_flight_fetch" : 0,
"task_max_waiting_in_queue_millis" : 0,
"active_shards_percent_as_number" : 100.0
}
[root@kibana ~]# curl -XGET 'http://192.168.0.114:9200/_cat/nodes?pretty'
192.168.0.116 8 94 14 0.32 0.33 0.18 mdi * es2
192.168.0.114 10 89 9 0.15 0.21 0.13 - - es4
192.168.0.117 9 95 10 0.35 0.33 0.17 mdi - es3
192.168.0.115 9 94 11 0.23 0.23 0.13 mdi – es1
logstash (192.168.0.112)
[root@logstash conf.d]# /usr/share/logstash/bin/logstash -f test1.conf
[INFO ] 2019-03-21 22:20:12.293 [[main]-pipeline-manager] elasticsearch - New Elasticsearch output {:class=>"LogStash::Outputs::ElasticSearch", :hosts=>["//192.168.0.115", "//192.168.0.116", "//192.168.0.117", "//192.168.0.114"]}
[INFO ] 2019-03-21 22:20:13.027 [Ruby-0-Thread-1: /usr/share/logstash/vendor/bundle/jruby/2.3.0/gems/stud-0.0.23/lib/stud/task.rb:22] pipeline - Pipeline started succesfully {:pipeline_id=>"main", :thread=>"#
[INFO ] 2019-03-21 22:20:13.039 [Ruby-0-Thread-1: /usr/share/logstash/vendor/bundle/jruby/2.3.0/gems/stud-0.0.23/lib/stud/task.rb:22] agent - Pipelines running {:count=>1, :pipelines=>["main"]}


