SAS(十二)PROC步
SAS(十二)PROC步
- Proc- 用在proc步的开头并规定用户使用的SAS过程名字及其他信息
- Var-规定用这个过程分析的一些变量
- Model-规定在模型中类似表示因变量(左)和自变量(右)的这样一些变量及其他信息
- Weight-规定一个变量,它的值是这些观测的相应权数
- Freq-规定一个变量,其值表示频数
- Id-规定一个或几个变量,他们的值在打印输出中或由此过程产生的SAS数据集中用来识别观测
- Where-在SAS把观测引入proc步之前,用来选择符合特殊条件的观测
- Class-在分析中指定一些变量为分类变量
- By-规定一些变量,SAS过程对输入数据集用by变量定义的几个数据组分别进行分析处理
- Output-给出用该过程产生的输出数据集的信息
- Quit-结束交互式的过程
- 其他如Attrib属性语句、format输出格式语句、label标签语句等
data insurance;
  input id y x1 x2;
  label id="序号" y="人寿保险额(千元)" x1="年人均收入(千元)" x2="风险反感度";
  cards;
1  19.6 66.290 7
2  6.3  40.964 5
3  25.2 72.996 10
4  8.4  45.010 6
5  12.6 57.204 4
6  1.4  26.852 5
7  4.9  38.122 4
9  26.6 75.796 9
10 4.9  37.408 5
11 10.5 54.376 2
12 9.8  46.386 7
13 7.7  46.130 4
14 1.4  30.366 3
15 5.6  39.060 5
16 24.5 79.380 1
17 13.3 52.766 8
18 13.3 55.916 6
;
proc reg;
model y=x1 x2;
run;
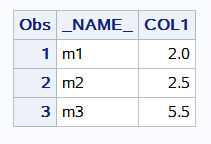
Transpose(转置过程)
- Transpose过程完成对sas数据集的转置,即把观测变为变量,变量变为观测。
- Out选项规定输出数据集
- Prefix选项规定转置后的变量名前缀
- Id选项使用其后规定的变量值作为输出数据集中被转置的变量名
title;
data aaa;
input m1-m3 x $;
cards;
2 2.5 5.5 a
;
run;
proc transpose data=aaa out=zzz;
var m1 m2 m3 ;
*id x;
run;
proc print data=zzz;
run;
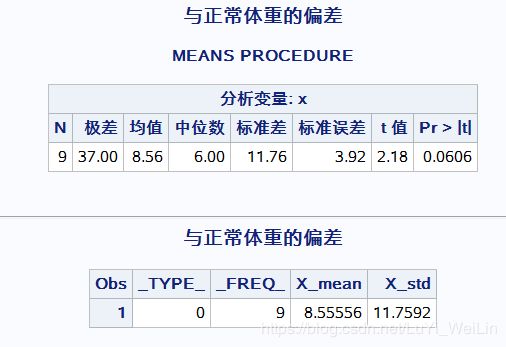
Means均值过程
- 计算数据集中数值变量的简单统计量
- T选项:检验数据总体均值为0的假设时,t统计量的值
- Prt选项:Prob >|T| , 数据总体均值为0的概率是多少
- 默认生成的_type_和_freq_变量分别规定分组数(如果有)和频率
- Maxdec选项规定输出结果的小数部分最大位数
- 可以输出的统计量:
N, Nmiss, mean, std, min, max, range, sum, var, uss, css, cv(变异系数), stderr, t, prt, sumwgt, skewness(偏度), kurtosis(峰度), clm(置信限), lclm(置信下限), uclm(置信上限)
data x;
   title '与正常体重的偏差';
   input x @@;
   cards;
-7  -2 1 3 6 10 15 21 30
;
proc means data=x maxdec=2 n range mean median std stderr t prt;
     output out=x1 mean=X_mean std=X_std;
run;
proc print data=x1;
run;
data;
input class $ a amount;
cards;
a 3 0.8
b 4 0.2
;
run;
proc means n mean;
var a;
weight amount;
run;
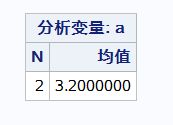
data;
input class $ a amount;
cards;
a 3 3
b 4 2
;
run;
proc means n mean;
var a;
freq amount;/*freq后规定的变量,其值不能小于1*/
run;

Format过程
- 使用Format过程把输出格式同Data步、Proc步的变量联系起来。
- 输出格式一:SAS格式
- 输出格式二:Format定义的格式,形如value 格式名 变量值=‘自定义值’;
proc …;
format 变量 格式名.; - 输出格式三:图示输出,只适用于数值型变量,形如
picture 格式名 other=’格式化值’;
proc …;
format 变量 格式名.;
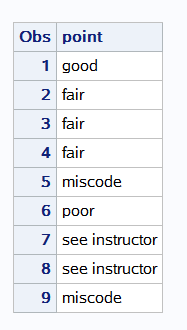
proc format;
  value $grade 'a'='good'
               'b'-'d'='fair'
               'f'='poor'
               'i','u'='see instructor'
                other='miscode';
run;
data;
  input point $ @@;
  format point $ grade.;
  cards;
  a  b  c  d  e  f  i  u  z
  ;
  run;
proc print;
run;
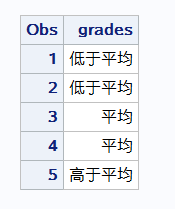
proc format;
  value zxs low-49='低于平均'
            50-99='平均'
                  100-high='高于平均';
run;
data;
  input grades @@ ;
  format grades zxs.;
  cards;
   -2 32 50  70  111
  ;
run;
proc print;
run;
proc format;
    value fm 1='男' 2='女';
run;
data;
input gender @@;
cards;
1 2 1 1
;
run;
proc print;
format gender fm.;
run;

proc format;/*图示输出格式只对数值型变量有效*/
    picture mobile  other='000/0000-0000';
        picture tel  other='111-11111111';
        data a;
          input mobile_num tel_num;
          format mobile_num mobile.;
          format tel_num tel.;
          cards;
          13693065109  01088512197
          13903706800  01088567636
          ;
proc print;
run;

Plot过程
- 对数据集中任两个变量的n个观测值画出散点图,第一个变量表示y轴,第二个表示为x轴
- 两种情况:
plot y*x=‘+’;(规定一个字符作为作图字符)
plot y*x=sex;(作图字符由变量的值给出) - Vref(Href)要求散布图在垂直(或水平)轴的一些规定值上画水平线(或垂直线)作为参照线
- /overlap选项:在同一张图上作两个以上的散点图。如:plot y*x a*b /overlay;
data prom;
  *sex=1;
  do x=0 to 5 by 0.05;
     y=x*sin(2*x);
     z=cos(x);
     output;
  end;
proc plot;
  plot y*x='*' /vref=0;/*z*x=sex overlay*/
  title '制作函数图形y=x*sin(2x)';
run;
quit;

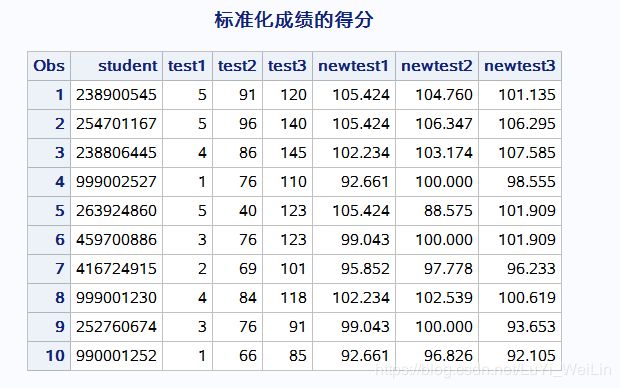
Standard标准化过程
- 目的是使不同量纲的变量能互相比较
- Standard过程按给定的均值和标准差对数据集中的变量进行标准化变换,并生成一个包含标准化值的新SAS数据集
- Mean=mean-value: 规定均值
- Std=std-value: 规定标准差
data a;
  input student test1-test3;
  newtest1=test1;
  newtest2=test2;
  newtest3=test3;
  cards;
  238900545  5  91  120
  254701167  5  96  140
  238806445  4  86  145
  999002527  1  76  110
  263924860  5  40  123
  459700886  3  76  123
  416724915  2  69  101
  999001230  4  84  118
  252760674  3  76  91
  990001252  1  66  85
  ;
  run;
  proc standard mean=100  std=5 out=new;
        var newtest1-newtest3;
        title 'PROC STANDARD 语句规定选项PRINT后产生的输出';
        run;
  proc print data=new;
    title '标准化成绩的得分';
        run;
  proc means data=new(drop=student) maxdec=2 n mean  std;
        title 'PROC MEAN 产生的输出';
        run;

Rank过程
- 与其研究数值大小不如研究排序的情况
- 该过程把数值从最小到最大排列,对最小值赋予秩1,对第二小值赋予秩2,一直到赋予秩n,即未丢失的观测个数。
- 出现结值(tie)时,其秩可以赋予平均秩或高秩或低秩。
- Ranks 选项分配求秩后的变量名
data a;
  input location gain @@;
  cards;
  1  7.2  1  7.9  1  7.6  1  6.3  1  8.4
  1  8.1  2  8.1  2  7.3  2  7.7  2  7.7
  ;
  proc rank ties=low;/*high,mean*/
    var gain;
    ranks rankgain;
  proc print;
        title '变量GAIN值的秩';
  proc rank data=a  out=b;
        by location;
        var gain;
    ranks rgain;
  proc print;
        by location;
    title '在不同位置上求秩';
    run;


Univariate过程
- 又称单变量过程,可以求单个变量的大部分统计指标
- Normal选项:要求对数据服从正态分布(原假设)进行检验。当样本容量<=2000时,使用W统计量检验;当样本容量>2000时,使用D统计量检验
- Output out=datasets要求输出包含指定统计量的数据集
- Pctlpts规定该过程不能自动提供而用户又希望计算的百分位数
- Pctlpre要求给出百分位数的输出变量名的前缀,pctlname……后缀。
data pf70 pm70 pf80 pm80 ;
  input state $ popf70 popm70 popf80 popm80 @@;
  drop popf70 popm70 popf80 popm80;
  decade=70;
  sex='女';pop=popf70;output pf70;
  sex='男';pop=popm70;output pm70;
  decade=80;
  sex='女';pop=popf80;output pf80;
  sex='男';pop=popm80;output pm80;
  cards;
  ala   1.78 1.66 2.02 1.87        alaska  0.14  0.16  0.19  0.21
  ariz   0.90  0.87  1.38  1.34    ark  0.99 0.93  1.18  1.10
  calif  10.14 9.82 12.00  11.67   colo  1.12  1.09  1.46  1.43
  conn  1.56  1.47  1.61  1.50     del  0.28  0.27  0.31  0.29
  fla  3.51 3.28 5.07 4.68         ga  2.36 2.23 2.82 2.64
  haw 0.37 0.40 0.47 0.49          idaho 0.36 0.36 0.47 0.47
  ill 5.72 5.39 5.89 5.54          ind  2.66 2.53 2.82 2.67
  iowa 1.45 1.37 1.50 1.41         kan  1.15 1.02 1.21 1.61
  ky  1.64 1.58 1.87 1.79          la 1.87 1.77 2.17 2.04
  me  0.51 0.48 0.58 0.55          md 2.01 1.92 2.17 2.04
  mass 2.97 2.72 3.01 2.73         mich 4.53 4.39 4.75 4.52
  minn 1.94 1.86 2.08 2.00         miss 1.14 1.07 1.31 1.21
  mo  2.42 2.26 2.55 2.37          mont 0.35 0.35 o.39 0.39
  neb 0.76 0.72 0.80 0.77          nev  0.24 0.25 0.40 0.41
  nh 0.38 0.36 0.47 0.45           nj 3.70 3.47 3.83 3.53
  nm 0.52 0.50 0.66 0.64           ny 9.52 8.72 9.22 8.34
  nc 2.59 2.49 3.03 2.86           nd 0.31 0.31 0.32 0.33
  ohio 5.49 5.16 5.58 5.22         okla 1.31 1.25 1.55 1.48
  ore 1.07 1.02 1.34 1.30          pa 6.13 5.67 6.18 5.68
  ri 0.48 0.46 o.50 0.45           sc 1.32 1.27 1.60 1.52
  sd 0.34 0.33 0.35 0.34           tenn 2.03 1.90 2.37 2.22
  texas 5.72 5.48 7.23 7.00        utah 0.54 0.52 0.74 0.72
  vt 0.23 0.22 0.26 0.25           va   2.35 2.30 2.73 2.62
  wash 1.72 1.69 2.08 2.05         w.va 0.90 0.84 1.00 0.95
  wis 2.25 2.17 2.40 2.31          wyo 0.16 0.17 0.23 0.24
  xx  . . . .                      yy .      .    .    .

  ;
  run;
  data popstate;
    set pf70 pm70  pf80  pm80;
        by decade sex;
        label pop='用百万表示的人口调查';
        run;
  proc univariate data=popstate normal ;
        by decade sex;
        var pop;
        id state;
        output out=univout mean=popmean median=popn50 /*var 规定的变量的mean和median;*/
    pctlpre=pop pctlpts=50,95 to 100 by 2.5;
    run;
  proc print data=univout;
        title '由UNIVARIATE过程产生的输出数据集';
        format popn50 pop50 pop95 pop97_5 pop100 best8.;
        run;

Corr过程
- 计算变量间的相关系数
- 相关是度量两个变量间线性关系强弱程度的一种测度。
- 如果一个变量恰好可表示成另一个变量Y的线性函数,那么相关系数为1或-1,即正相关或负相关。如果两变量间的相关系数为0,这意味着两变量无线性关系。


 proc format;
    value specname
       1='SETOSA    '
       2='VERSICOLOR'
       3='VIRGINICA ';
 run;


 data iris;
    input sepallen sepalwid petallen petalwid species @@;/*花萼与花瓣*/
    format species specname.;
    label sepallen='Sepal Length in mm.'
          sepalwid='Sepal Width  in mm.'
          petallen='Petal Length in mm.'
          petalwid='Petal Width  in mm.';
    cards;
 50 33 14 02 1 64 28 56 22 3 65 28 46 15 2 67 31 56 24 3
 63 28 51 15 3 46 34 14 03 1 69 31 51 23 3 62 22 45 15 2
 59 32 48 18 2 46 36 10 02 1 61 30 46 14 2 60 27 51 16 2
 65 30 52 20 3 56 25 39 11 2 65 30 55 18 3 58 27 51 19 3
 68 32 59 23 3 51 33 17 05 1 57 28 45 13 2 62 34 54 23 3
 77 38 67 22 3 63 33 47 16 2 67 33 57 25 3 76 30 66 21 3
 49 25 45 17 3 55 35 13 02 1 67 30 52 23 3 70 32 47 14 2
 64 32 45 15 2 61 28 40 13 2 48 31 16 02 1 59 30 51 18 3
 55 24 38 11 2 63 25 50 19 3 64 32 53 23 3 52 34 14 02 1
 49 36 14 01 1 54 30 45 15 2 79 38 64 20 3 44 32 13 02 1
 67 33 57 21 3 50 35 16 06 1 58 26 40 12 2 44 30 13 02 1
 77 28 67 20 3 63 27 49 18 3 47 32 16 02 1 55 26 44 12 2
 50 23 33 10 2 72 32 60 18 3 48 30 14 03 1 51 38 16 02 1
 61 30 49 18 3 48 34 19 02 1 50 30 16 02 1 50 32 12 02 1
 61 26 56 14 3 64 28 56 21 3 43 30 11 01 1 58 40 12 02 1
 51 38 19 04 1 67 31 44 14 2 62 28 48 18 3 49 30 14 02 1
 51 35 14 02 1 56 30 45 15 2 58 27 41 10 2 50 34 16 04 1
 46 32 14 02 1 60 29 45 15 2 57 26 35 10 2 57 44 15 04 1
 50 36 14 02 1 77 30 61 23 3 63 34 56 24 3 58 27 51 19 3
 57 29 42 13 2 72 30 58 16 3 54 34 15 04 1 52 41 15 01 1
 71 30 59 21 3 64 31 55 18 3 60 30 48 18 3 63 29 56 18 3
 49 24 33 10 2 56 27 42 13 2 57 30 42 12 2 55 42 14 02 1
 49 31 15 02 1 77 26 69 23 3 60 22 50 15 3 54 39 17 04 1
 66 29 46 13 2 52 27 39 14 2 60 34 45 16 2 50 34 15 02 1
 44 29 14 02 1 50 20 35 10 2 55 24 37 10 2 58 27 39 12 2
 47 32 13 02 1 46 31 15 02 1 69 32 57 23 3 62 29 43 13 2
 74 28 61 19 3 59 30 42 15 2 51 34 15 02 1 50 35 13 03 1
 56 28 49 20 3 60 22 40 10 2 73 29 63 18 3 67 25 58 18 3
 49 31 15 01 1 67 31 47 15 2 63 23 44 13 2 54 37 15 02 1
 56 30 41 13 2 63 25 49 15 2 61 28 47 12 2 64 29 43 13 2
 51 25 30 11 2 57 28 41 13 2 65 30 58 22 3 69 31 54 21 3
 54 39 13 04 1 51 35 14 03 1 72 36 61 25 3 65 32 51 20 3
 61 29 47 14 2 56 29 36 13 2 69 31 49 15 2 64 27 53 19 3
 68 30 55 21 3 55 25 40 13 2 48 34 16 02 1 48 30 14 01 1
 45 23 13 03 1 57 25 50 20 3 57 38 17 03 1 51 38 15 03 1
 55 23 40 13 2 66 30 44 14 2 68 28 48 14 2 54 34 17 02 1
 51 37 15 04 1 52 35 15 02 1 58 28 51 24 3 67 30 50 17 2
 63 33 60 25 3 53 37 15 02 1
 ;
proc corr nomiss cov;/*nomiss选项规定在分析中若某个变量有缺失值,则相应的观测
从所有计算中删去;COV选项要求输出协方差*/
var sepallen sepalwid;  /*变量在相关阵的上方*/
with petallen petalwid;   /*变量在相关阵的左边*/
title '长方形的COV和CORR阵';
run;
Options过程
- 列出SAS系统选项的当前值。
- SAS系统选项是SAS系统用来控制SAS数据集的处理,输出的格式和内容等的全局选项
- 系统选项的优先次序:
options语句>配置文件>缺省设置
设置输出界面无日期显示
options nodate;
title;
data;
input a;
cards;
1
2
3
;
run;
proc print;
run;
Printto过程
- 该过程用来定义SAS过程输出和SAS日志输出的地点
- Print选项规定输出结果存放地点
- Log选项规定输出日志存放地点
- New选项表示要覆盖已存在的文件,如无new选项但有已存在的文件名,则在已有的文件内容后追加
data numbers;
  input x y z;
  cards;
14.2   25.2    96.8
10.8   51.6    96.8
9.5    34.2    138.2
8.8    27.6    83.2
11.5   49.4    287.0
6.3    42.0    170.7
;
proc printto new  print="c:\PRINTOUT.TXT";
run;
proc print;
   title '把PROC PRINT 的输出送到文件PRINTOUT.TXT中';
run;
proc printto;      /*恢复默认输出*/
run;
proc print;
var x;
run;
Compare过程
- 该过程用来比较两个SAS数据集中的内容
- 用base和compare选项分别规定待比较的两个数据集
data aaa;
input x y;
cards;
1 2
3 4
;
run;
data bbb;
input x y $;
cards;
1 a
2 b
;
run;
proc compare base=aaa compare=bbb;
run;
部分结果输出:

SQL过程
- SQL 结构查询语言(Structured Query Language) 是一个标准化的广泛使用的语言,可以检索和更新关系表格和数据库中的数据。
- 关系,类似于数学中的集合概念,实际上被表现为一些排列成行和列的二维表格(关系数据库)
- SQL语句的特征:
子句内的项用逗号分开;
不需规定Run语句; - Select语句用来检索和操作存于表中的数据。(order从句,format选项)
- Create语句生成表格
- Update语句增加或修改在表格的列里的数值,Insert和Delete语句插入和删除行,用Alter语句增加、修改、删去列来修改表格。
- Delete语句从表中删去where表达式为真的所有行
- Insert to往一个新的或已存在的表中加入新的行
data sasuser.employee;
  input empname $ empcity $ empyears emptitle $ sales;
  cards;
aa   beijing   3   engineer 2300
bb   shangqiu  2   teacher  3000
cc   changsha  32  worker   4000
dd   changsha  20  salesrep 1000
;
proc sql;
create table changsha as   /*对表格的操作*/
  select empname,empcity,empyears format=yymmdd8.,/*对表格列的操作*/
         sales*2 as totalsales, emptitle
         from sasuser.employee
  where empcity='changsha'
  order by empyears asc;  /*asc*/
alter table changsha
  add gender char(1);   /*对表格列的操作,modify,drop*/
update changsha         /*对表格值的操作*/
  set gender='f'
  where empname in ('aa','cc');
update changsha
  set gender='m'
  where gender is missing;
insert into changsha    /*对表格行的操作*/
values('ff', 'changsha',10, 8000,'teacher','m');
delete from changsha    /*对表格行的操作*/
where empyears>20;

quit;
proc print data=changsha;
run;
