python matplotlib pyecharts绘制股市行情个股信息K线动态图表
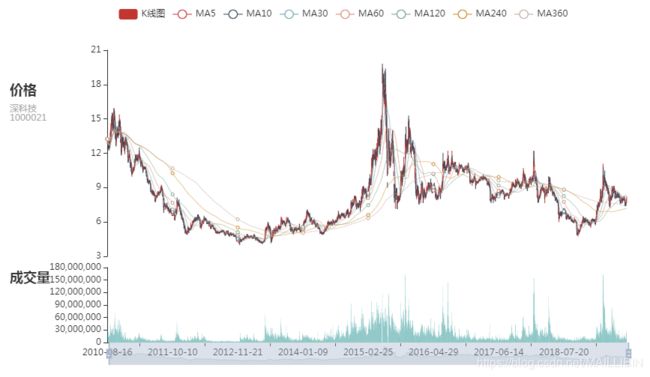
pyecharts-1.4.0 绘制的K线图:
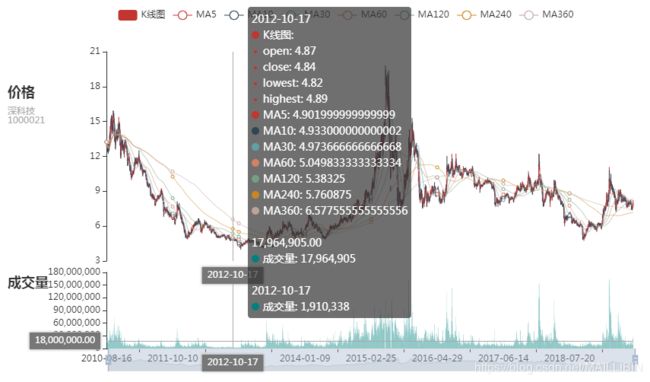
pyecharts-1.4.0 绘制的K线图:
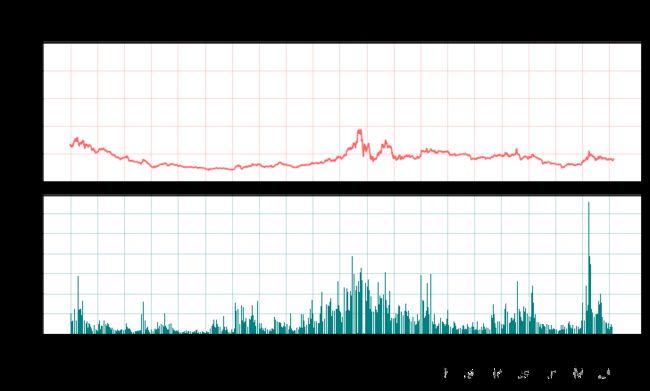
matplotlib绘制的图:
全部代码:
# coding: utf-8

# In[1]:


# 从网上获取股票交易历史数据
# url = 'http://quotes.money.163.com/service/chddata.html?code=1000001&start=19910401&end=19910409'
# url += '&fields=LCLOSE;TOPEN;HIGH;LOW;TCLOSE;CHG;PCHG;TURNOVER;VOTURNOVER;VATURNOVER;TCAP;MCAP'

import requests
import pandas as pd
import matplotlib.pyplot as plt


#stock_code='1000001'
stock_code='1000021'
start_date='20100815'
end_date='20190815'

url = 'http://quotes.money.163.com/service/chddata.html?code={}&start={}&end={}'.format(stock_code,start_date,end_date)

#从网上获取数据
online_data=requests.get(url)

csv_file_name='stock_{}.csv'.format(stock_code)

#将数据保存到本地csv文件
with open(csv_file_name,"wb") as f:
    f.write(online_data.content)

stock_data=pd.read_csv(csv_file_name,encoding='gb2312')

stock_data=stock_data.sort_values(by = ["日期"],ascending = [True],inplace=False)


# In[2]:


stock_data_cleared=stock_data[stock_data['收盘价']>0]

stock_name=stock_data_cleared["名称"][0]

row_count=stock_data_cleared.shape[0]
xtick_interval=int(row_count/20)
xtick_index=range(0,row_count,xtick_interval)

plt.figure(figsize=(12, 6))

plt.rcParams['font.sans-serif'] = ['SimHei']  # 用来正常显示中文标签
plt.rcParams['axes.unicode_minus'] = False  # 用来正常显示负号

plt.subplot(211)
plt.plot(range(row_count),stock_data_cleared['收盘价'],color="#ff6666")
#plt.xticks(xtick_index,stock_data_cleared.iloc[xtick_index,0],rotation=60)
plt.xticks(xtick_index,"")
plt.yticks(range(0,60,10))
#plt.xlabel("时间")
plt.ylabel("收盘价")
plt.grid(linewidth=0.5,color="#ff6666",alpha=0.5)
plt.title(stock_name+"\n\n股票代码"+stock_code)

plt.subplot(212)
plt.bar(range(row_count),stock_data_cleared["成交量"],color="#008080")
plt.xticks(xtick_index,stock_data_cleared.iloc[xtick_index,0],rotation=70)
plt.grid(linewidth=0.5,color="#008080",alpha=0.5)

plt.subplots_adjust(hspace=0.1)
plt.ylabel("成交量")

plt.show()


# In[3]:


stock_data_extracted=stock_data_cleared[["开盘价","收盘价","最低价","最高价","成交量","日期"]]


# In[4]:


#移动平均数计算
def moving_average(data,day_count):
    data=data.values[:,0]
    result=[]
    for i in range(len(data)):
        start_day_index=i-day_count+1
        if start_day_index<=0:
            start_day_index=0
        justified_day_count=i-start_day_index+1
        mean=data[start_day_index:i+1].sum()/justified_day_count
        result.append(mean)
    return result


# In[5]:


from pyecharts.charts import Page,Kline,Bar,Grid,Line
from pyecharts import options as opts
import webbrowser as wb

# pyecharts V1 版本开始支持链式调用
#文档地址 https://pyecharts.org/#/zh-cn/

#k线
kline=(
    Kline()
    .add_xaxis(stock_data_extracted["日期"].values.tolist())
    .add_yaxis("K线图", stock_data_extracted.iloc[:,:4].values.tolist())
    .set_global_opts(
        xaxis_opts=opts.AxisOpts(is_scale=True,is_show=False),
        #axis_opts=opts.AxisOpts(is_scale=True,min_=0), #y轴起始坐标可以设为0
        yaxis_opts=opts.AxisOpts(is_scale=True), #y轴起始坐标可自动调整
        title_opts=opts.TitleOpts(title="价格",subtitle=stock_name+"\n"+stock_code,pos_top="20%"),
        axispointer_opts=opts.AxisPointerOpts(
            is_show=True,
            link=[{"xAxisIndex": "all"}],
            label=opts.LabelOpts(background_color="#777"),
        ),
        datazoom_opts=[ #设置zoom参数后即可缩放
            opts.DataZoomOpts(
                is_show=True,
                type_="inside",
                xaxis_index=[0,1], #设置第0轴和第1轴同时缩放
                range_start=0,
                range_end=100,
            ),
            opts.DataZoomOpts(
                is_show=True,
                xaxis_index=[0,1],
                type_="slider",
                pos_top="90%",
                range_start=0,
                range_end=100,
            ),
        ],

    )
)

#移动平均线
line = (
    Line()
    .add_xaxis(xaxis_data=stock_data_extracted["日期"].values.tolist())
    .add_yaxis(
        series_name="MA5",
        y_axis=moving_average(stock_data_extracted[["收盘价"]], 5),
        is_smooth=True,
        is_hover_animation=False,
        linestyle_opts=opts.LineStyleOpts(width=1, opacity=0.5),
        label_opts=opts.LabelOpts(is_show=False),
    )
    .add_yaxis(
        series_name="MA10",
        y_axis=moving_average(stock_data_extracted[["收盘价"]], 10),
        is_smooth=True,
        is_hover_animation=False,
        linestyle_opts=opts.LineStyleOpts(width=1, opacity=0.5),
        label_opts=opts.LabelOpts(is_show=False),
    )
    .add_yaxis(
        series_name="MA30",
        y_axis=moving_average(stock_data_extracted[["收盘价"]], 30),
        is_smooth=True,
        is_hover_animation=False,
        linestyle_opts=opts.LineStyleOpts(width=1, opacity=0.5),
        label_opts=opts.LabelOpts(is_show=False),
    )
    .add_yaxis(
        series_name="MA60",
        y_axis=moving_average(stock_data_extracted[["收盘价"]], 60),
        is_smooth=True,
        is_hover_animation=False,
        linestyle_opts=opts.LineStyleOpts(width=1, opacity=0.5),
        label_opts=opts.LabelOpts(is_show=False),
    )
    .add_yaxis(
        series_name="MA120",
        y_axis=moving_average(stock_data_extracted[["收盘价"]], 120),
        is_smooth=True,
        is_hover_animation=False,
        linestyle_opts=opts.LineStyleOpts(width=1, opacity=0.5),
        label_opts=opts.LabelOpts(is_show=False),
    )
    .add_yaxis(
        series_name="MA240",
        y_axis=moving_average(stock_data_extracted[["收盘价"]], 240),
        is_smooth=True,
        is_hover_animation=False,
        linestyle_opts=opts.LineStyleOpts(width=1, opacity=0.5),
        label_opts=opts.LabelOpts(is_show=False),
    )
    .add_yaxis(
        series_name="MA360",
        y_axis=moving_average(stock_data_extracted[["收盘价"]], 360),
        is_smooth=True,
        is_hover_animation=False,
        linestyle_opts=opts.LineStyleOpts(width=1, opacity=0.5),
        label_opts=opts.LabelOpts(is_show=False),
    )
    .set_global_opts(xaxis_opts=opts.AxisOpts(type_="category"))
)

#将K线图和移动平均线显示在一个图内
kline.overlap(line)

#成交量柱形图
x=stock_data_extracted[["日期"]].values[:,0].tolist()
y=stock_data_extracted[["成交量"]].values[:,0].tolist()

bar = (
    Bar()
    .add_xaxis(x)
    .add_yaxis("成交量",y,label_opts=opts.LabelOpts(is_show=False),itemstyle_opts=opts.ItemStyleOpts(color="#008080"))
    .set_global_opts(title_opts=opts.TitleOpts(title="成交量",pos_top="70%"),
                     legend_opts=opts.LegendOpts(is_show=False),
                    )
)

#使用网格将多张图标组合到一起显示
grid_chart = Grid()

grid_chart.add(
    kline,
    grid_opts=opts.GridOpts(pos_left="15%", pos_right="8%", height="55%"),
)

grid_chart.add(
    bar,
    grid_opts=opts.GridOpts(pos_left="15%", pos_right="8%", pos_top="70%", height="20%"),
)

grid_chart.render("d:/kline_test.html")
wb.open("d:/kline_test.html")


