segmentation fault 段错误解决方法
一、出现Segmentation Fault
1. 文件打开失败却使用了fclose();fclose找不到指针fp。
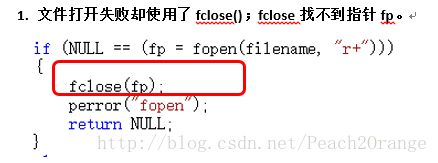
解决方法:
当打开文件成功,即成功获得文件句柄后,再进行关闭句柄操作。

2. 文件正在写操作,异常断电、程序异常中断,导致文件损坏,在重新上电或者程序重新启动后,以只读方式“r”打开该文件并读取时,系统找不到该文件,报错:Segment fault
解决方式:
建立备份文件。
若文件打开失败,则新建该文件,并将备份文件的内容拷贝到该文件中,重新读文件。
3. 数组越界导致segment fault
解决方法:改变数组大小,或者控制存入数组内容的多少。
二、段错误调试
1. 采用gdb调试器逐步查找段错误
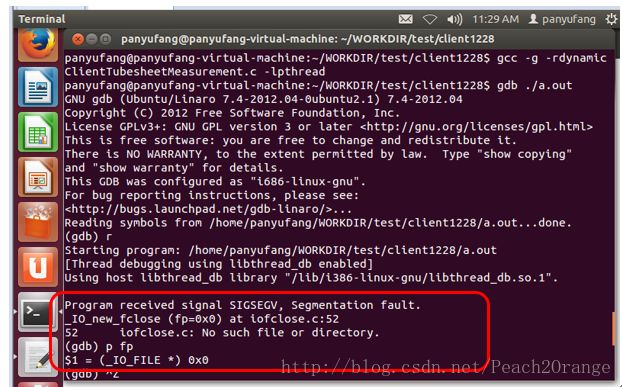
用gdb来调试,在运行到段错误的地方,会自动停下来并显示出错的行和行号。加上“-g -rdynamic"的参数进行编译,生成带有调试信息的可执行程序 a.out ,然后执行该程序。
例如绿色框:
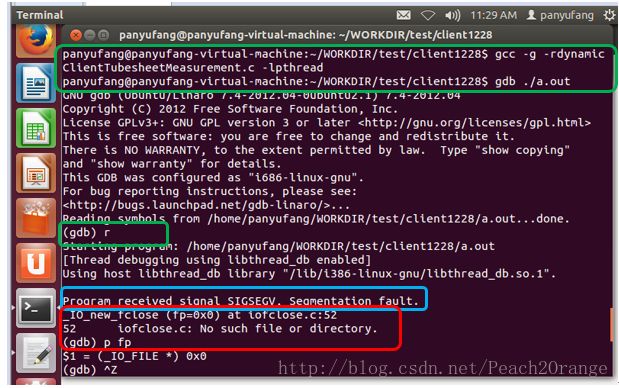
很快则可定位到红色框的错误处。
从蓝色框看出,进程是由于收到了SIGSEGV信号而结束的。通过进一步的查阅文档(man 7 signal),我们知道SIGSEGV默认handler的动作是打印”段错误"的出错信息,并产生Core文件,由此我们也可以通过捕获SIGSEGV信号来触发系统调用gdb来输出调试信息。
2. 关键部位输出(printf)信息
在程序内部的关键部位输出(printf)信息,那样可以跟踪 段错误 在代码中可能的位置
为了方便使用这种调试方法,可以用条件编译指令#ifdef DEBUG和#endif把printf函数给包含起来,编译的时候加上-DDEBUG参数就可以查看调试信息。反之,不加上该参数进行调试也可以。
2)用gdb来调试,在运行到段错误的地方,会自动停下来并显示出错的行和行号
这个应该是很常用的,如果需要用gdb调试,记得在编译的时候加上-g参数,用来显示调试信息
三、段错误及gdb调试详解
1)往受到系统保护的内存地址写数据
有些内存是内核占用的或者是其他程序正在使用,为了保证系统正常工作,所以会受到系统的保护,而不能任意访问.
例1
#include
int
main()
{
int i = 0;
scanf ("%d", i); /* should have used &i */
printf ("%d/n", i);
return 0;
}
编译和执行一下, 咋一看,好像没有问题哦,不就是读取一个数据然后给输出来吗?
falcon@falcon:~/temp$ gcc-g -o segerr segerr.c (–加-g选项查看调试信息)
falcon@falcon:~/temp$ gdb./segerr
GNU gdb 6.4-debian
Copyright 2005 Free Software Foundation, Inc.
GDB is free software, covered by the GNU General Public License, and you are
welcome to change it and/or distribute copies of it under certain conditions.
Type “show copying” to see the conditions.
There is absolutely no warranty for GDB. Type “show warranty” fordetails.
This GDB was configured as “i486-linux-gnu”…Using host libthread_db library “/lib/tls/i686/cmov/libthread_db.so.1″.
(gdb) l –用l(list)显示我们的源代码
1 #include
2
3 int
4 main()
5 {
6 int i = 0;
7
8 scanf (”%d”, i); /* should have used &i */
9 printf (”%d/n”, i);
10 return 0;
(gdb) b 8 –用b(break)设置断点
Breakpoint 1 at 0×80483b7: file segerr.c, line 8.
(gdb) p i –用p(print)打印变量i的值[看到没,这里i的值是0哦]
$1 = 0
(gdb) r –用r(run)运行,直到断点处
Starting program: /home/falcon/temp/segerr
Breakpoint 1, main () at segerr.c:8
8 scanf (”%d”, i); /* should have used &i */ –[试图往地址0处写进一个值]
(gdb) n –用n(next)执行下一步
10
Program received signal SIGSEGV, Segmentation fault.
0xb7e9a1ca in _IO_vfscanf () from /lib/tls/i686/cmov/libc.so.6
(gdb) c –在上面我们接收到了SIGSEGV,然后用c(continue)继续执行
Continuing.
Program terminated with signal SIGSEGV, Segmentation fault.
The program no longer exists.
(gdb) quit –退出gdb
果然:
我们“不小心”把&i写成了i
而我们刚开始初始化了i为0,这样我们不是试图向内存地址0存放一个值吗?
[补充:
可以通过man 7 signal查看SIGSEGV的信息。
falcon@falcon:~/temp$ man 7 signal | grep SEGV
Reformatting signal(7), please wait…
SIGSEGV 11 Core Invalid memory reference
例2:
#include
int
main()
{
char *p;
p = NULL;
*p = ‘x’;
printf(”%c”, *p);
return 0;
}
很容易发现,这个例子也是试图往内存地址0处写东西。
这里我们通过gdb来查看段错误所在的行
falcon@falcon:~/temp$ gcc -g -o segerr segerr.c
falcon@falcon:~/temp$ gdb ./segerr
GNU gdb 6.4-debian
Copyright 2005 Free Software Foundation, Inc.
GDB is free software, covered by the GNU General Public License, and you are
welcome to change it and/or distribute copies of it under certain conditions.
Type “show copying” to see the conditions.
There is absolutely no warranty for GDB. Type “show warranty” fordetails.
This GDB was configured as “i486-linux-gnu”…Using host libthread_db library “/lib/tls/i686/cmov/libthread_db.so.1″.
(gdb) r –直接运行,我们看到抛出段错误以后,自动显示出了出现段错误的行,这就是一个找出段错误的方法
Starting program:/home/falcon/temp/segerr
Program received signal SIGSEGV, Segmentation fault.
0×08048516 in main () at segerr.c:10
10 *p = ‘x’;
(gdb)
2)内存越界(数组越界,变量类型不一致等)
例3:
#include
int
main()
{
char test[1];
printf(”%c”, test[1000000000]);
return 0;
}
这里是比较极端的例子,但是有时候可能是会出现的,是个明显的数组越界的问题
或者是这个地址是根本就不存在的
例4:
#include
int
main()
{
int b = 10;
printf(”%s/n”, b);
return 0;
}
我们试图把一个整数按照字符串的方式输出出去,这是什么问题呢?
由于还不熟悉调试动态链接库,所以我只是找到了printf的源代码的这里
声明部分:
int pos =0 ,cnt_printed_chars =0 ,i ;
unsigned char *chptr ;
va_list ap ;
/* %s格式控制部分:*/
case 's':
chptr =va_arg (ap ,unsigned char *);
i =0 ;
while (chptr [i ])
{...
cnt_printed_chars ++;
putchar (chptr [i ++]);
}
由于我没有仔细分析代码,大致的原因也可能是地址越界的原因?不过我可不确定哦。
如果大家知道怎么调试printf函数,麻烦帮忙找出越界的真正原因吧,这个段错误也可能是处在va_start和va_arg等函数里头?或者直接看看这个这里的printf源代码的分析,看看是否可以找出出错的地方:
http://www.wangchao.net.cn/bbsdetail_47325.html
类似的,还有诸如:sprintf等的格式控制问题
比如,试图把char型或者是int的按照%s输出或存放起来,如:
#include
#include
char c=’c';
int i=10;
char buf[100];
printf(”%s”, c); //试图把char型按照字符串格式输出
printf(”%s”, i); //试图把int型按照字符串输出
memset(buf, 0, 100);
sprintf(buf, “%s”, c); //试图把char型按照字符串格式转换
memset(buf, 0, 100);
sprintf(buf, “%s”, i); //试图把int型按照字符串转换
3)其他
其实大概的原因都是一样的,就是段错误的定义。
段错误定义:
一句话来说,段错误是指访问的内存超出了系统给这个程序所设定的内存空间,例如访问了不存在的内存地址、访问了系统保护的内存地址、访问了只读的内存地址等等情况。
这里贴一个对于“段错误”的准确定义(参考Answers.com):
A segmentation fault (often shortened to segfault) is a particular errorcondition that can occur during the operation of computer software. In short, asegmentation fault occurs when a program attempts to access a memorylocation that it is not allowed to access, or attempts to access amemory location in a way that is not allowed (e.g., attempts to write to aread-only location, or to overwrite part of the operating system). Systemsbased on processors like the Motorola 68000 tend torefer to these events as Address or Bus errors.
Segmentation is one approach to memory management and protection in theoperating system. It has been superseded by paging formost purposes, but much of the terminology of segmentation is still used,"segmentation fault" being an example. Some operating systems stillhave segmentation at some logical level although paging is used as the mainmemory management policy.
On Unix-like operating systems, a processthat accesses invalid memory receives the SIGSEGV signal. On Microsoft Windows, a process that accesses invalid memory receives theSTATUS_ACCESS_VIOLATION exception.
但是更多的容易出错的地方就要自己不断积累,不段发现,或者吸纳前人已经积累的经验,并且注意避免再次发生。
例如:
<1>定义了指针后记得初始化,在使用的时候记得判断是否为NULL
<2>在使用数组的时候是否被初始化,数组下标是否越界,数组元素是否存在等
<3>在变量处理的时候变量的格式控制是否合理等