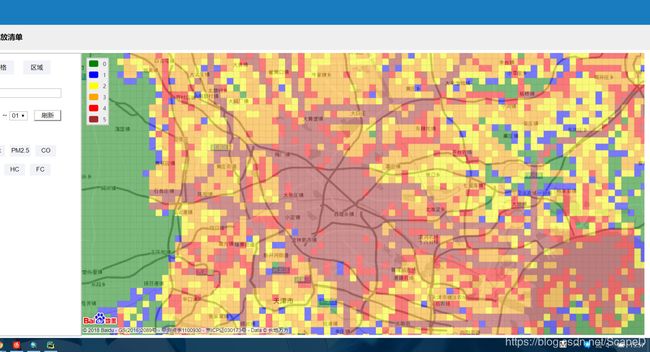
eCharts+百度地图实现格网统计图
格网统计图是一种将统计数据汇总到格网当中显示的统计图表,它的使用范围相当广泛。可以使用一点的监测值代表一个网格区域的值。可以不用使用插值而得到整个面的统计值。
eCharts本身并不提供格网统计图的实现,但eCharts提供的用户自定义图表可以帮助我们实现。
1,引入相关JS引用
2,定义标签及其样式
3,初始化图表
var dom = document.getElementById("MapDiv");
var myChart = echarts.init(dom);
如图4所示,定义网格颜色,范围,行列数
var COLORS = ["green", "blue", "yellow", "orange", "red", "brown"];
var lngExtent = [38.5, 40.3];
var latExtent = [116.7, 119];
var cellCount = [112, 182];
5,定义网格渲染方式
var cellSizeCoord = [
    (lngExtent[1] - lngExtent[0]) / cellCount[0],
    (latExtent[1] - latExtent[0]) / cellCount[1]
];
var gapSize = 0;

function renderItem(params, api) {
    var context = params.context;
    var lngIndex = api.value(0);
    var latIndex = api.value(1);
    var coordLeftTop = [
        +(latExtent[0] + lngIndex * cellSizeCoord[0]).toFixed(6),
        +(lngExtent[0] + latIndex * cellSizeCoord[1]).toFixed(6)
    ];
    var pointLeftTop = getCoord(params, api, lngIndex, latIndex);
    var pointRightBottom = getCoord(params, api, lngIndex + 1, latIndex + 1);

    return {
        type: 'rect',
        shape: {
            x: pointLeftTop[0],
            y: pointLeftTop[1],
            width: pointRightBottom[0] - pointLeftTop[0],
            height: pointRightBottom[1] - pointLeftTop[1]
        },
        style: api.style({
            stroke: 'rgba(0,0,0,0.1)'
        }),
        styleEmphasis: api.styleEmphasis()
    };
}

function getCoord(params, api, lngIndex, latIndex) {
    var coords = params.context.coords || (params.context.coords = []);
    var key = lngIndex + '-' + latIndex;

    // bmap returns point in integer, which makes cell width unstable.
    // So we have to use right bottom point.
    return coords[key] || (coords[key] = api.coord([
        +(latExtent[0] + lngIndex * cellSizeCoord[0]).toFixed(6),
        +(lngExtent[0] + latIndex * cellSizeCoord[1]).toFixed(6)
    ]));
}
如图6所示,设置参数选项
option = {
    tooltip: {},
    visualMap: {
        type: 'piecewise',
        inverse: true,
        top: 10,
        left: 10,
        pieces: [{
            value: 0, color: COLORS[0]
        }, {
            value: 1, color: COLORS[1]
        }, {
            value: 2, color: COLORS[2]
        }, {
            value: 3, color: COLORS[3]
        }, {
            value: 4, color: COLORS[4]
        }, {
            value: 5, color: COLORS[5]
        }],
        borderColor: '#ccc',
        borderWidth: 2,
        backgroundColor: '#eee',
        dimension: 2,
        inRange: {
            color: COLORS,
            opacity: 0.5
        }
    },
    series: [
        {
            type: 'custom',
            coordinateSystem: 'bmap',
            renderItem: renderItem,
            animation: false,
            itemStyle: {
                emphasis: {
                    color: 'yellow'
                }
            },
            encode: {
                tooltip: 2
            },
            data: values
        }
    ],
    bmap: {
        center: [117.4, 39.3],
        zoom: 11.8,
        roam: true,
        mapStyle: {
            styleJson: [{
                'featureType': 'water',
                'elementType': 'all',
                'stylers': {
                    'color': '#d1d1d1'
                }
            }, {
                'featureType': 'land',
                'elementType': 'all',
                'stylers': {
                    'color': '#f3f3f3'
                }
            }, {
                'featureType': 'railway',
                'elementType': 'all',
                'stylers': {
                    'visibility': 'off'
                }
            }, {
                'featureType': 'highway',
                'elementType': 'all',
                'stylers': {
                    'color': '#999999'
                }
            }, {
                'featureType': 'highway',
                'elementType': 'labels',
                'stylers': {
                    'visibility': 'off'
                }
            }, {
                'featureType': 'arterial',
                'elementType': 'geometry',
                'stylers': {
                    'color': '#fefefe'
                }
            }, {
                'featureType': 'arterial',
                'elementType': 'geometry.fill',
                'stylers': {
                    'color': '#fefefe'
                }
            }, {
                'featureType': 'poi',
                'elementType': 'all',
                'stylers': {
                    'visibility': 'off'
                }
            }, {
                'featureType': 'green',
                'elementType': 'all',
                'stylers': {
                    'visibility': 'off'
                }
            }, {
                'featureType': 'subway',
                'elementType': 'all',
                'stylers': {
                    'visibility': 'off'
                }
            }, {
                'featureType': 'manmade',
                'elementType': 'all',
                'stylers': {
                    'color': '#d1d1d1'
                }
            }, {
                'featureType': 'local',
                'elementType': 'all',
                'stylers': {
                    'color': '#d1d1d1'
                }
            }, {
                'featureType': 'arterial',
                'elementType': 'labels',
                'stylers': {
                    'visibility': 'off'
                }
            }, {
                'featureType': 'boundary',
                'elementType': 'all',
                'stylers': {
                    'color': '#fefefe'
                }
            }, {
                'featureType': 'building',
                'elementType': 'all',
                'stylers': {
                    'color': '#d1d1d1'
                }
            }, {
                'featureType': 'label',
                'elementType': 'labels.text.fill',
                'stylers': {
                    'color': 'rgba(0,0,0,0)'
                }
            }]
        }
    }
};;
PS,数据样式
所有数据构成一个数组,如:
[[0,0,1],[1,0,3]]其中每个格网的值又是一个数组,第一个数位列,第二个数为行,第三个数为值
即[col,row,val]
全部代码:
实例下载:eCharts实现格网统计图
