分布式服务链路跟踪组件Sleuth
在分布式系统中,各系统之间相互调用,如何跟踪每个服务的调用情况,就显得比较重要了。Spring Cloud提供的Sleuth组件,就可以很容易的帮我们解决这个问题。
环境:Spring Boot版本是1.5.13.RELEASE,Spring Cloud版本是Edgware.SR3
1.首先,我们要创建一个ZipKin Server项目,用来收集跟踪日志,进行可视化展示。
1.1 添加maven依赖
            io.zipkin.java
            zipkin-autoconfigure-ui


            io.zipkin.java
            zipkin-server


            org.springframework.boot
            spring-boot-starter-web
1.2 启动类添加注解@EnableZipkinServer
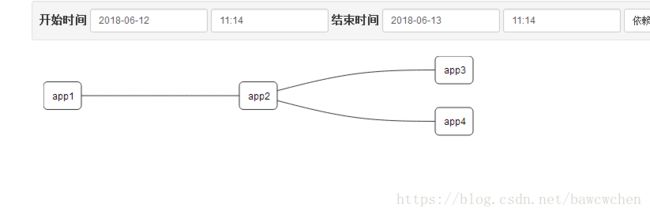
2. 然后,我们创建分布式服务应用。这里我是app1调用app2,app2调用app3和app4。
app1,app2,app3,app4项目的配置差不多的,就是提供的服务不一样,我就只介绍app1的搭建,其他类似。
2.1 添加maven依赖
            org.springframework.cloud
            spring-cloud-starter-zipkin


            org.springframework.boot
            spring-boot-starter-web
2.2 启动类
@SpringBootApplication
@RestController
public class App1Application{

    private static final Log log = LogFactory.getLog(App1Application.class);

    public static void main(String[] args) {
        SpringApplication.run(App1Application.class, args);
    }

    @Autowired
    private RestTemplate restTemplate;

    @Bean
    public RestTemplate restTemplate() {
        return new RestTemplate();
    }

    @RequestMapping("/hello")
    public String hello() throws InterruptedException {
        log.info("request start");
        String s = restTemplate.getForObject("http://localhost:8901/redirect", String.class);
        return s;
    }

    @RequestMapping("/redirect")
    public String redirect() throws InterruptedException {
        log.info("redirect");
        return restTemplate.getForObject("http://localhost:8902/getMessage", String.class);
    }
}
2.3 application.yml
server:
    port: 8901
spring:
    zipkin:
       baseUrl: http://localhost:9411   //zipKin server的地址
    application:
       name: app1

    sleuth:
       sampler:
          percentage: 1
在本项目中,用的是spring.sleuth.sampler.percentage=1,来收集跟踪日志,可以看到依赖图,而实例化AlwaysSampler方式,看不到依赖图,不知道为什么。可能是版本不一样原因。
启动zipkin server,app1,app2,app3,app4,建议打jar包,以jar包方式启动。
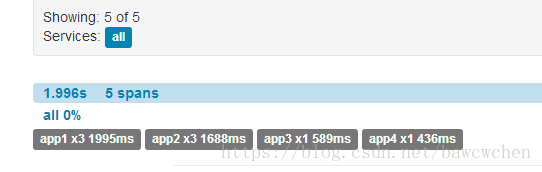
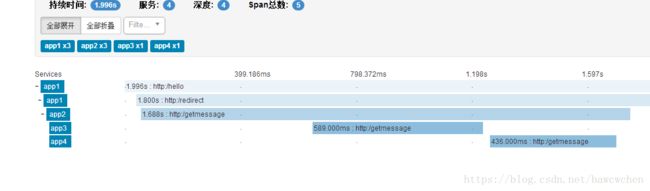
浏览器中访问:localhost:8901/hello。我们再访问http://localhost:9411。可以看到如下服务跟踪情况。
服务依赖图:
项目源码:https://github.com/bawcwchen/sleuthDemo.git