强大的Winform Chart图表控件使用说明
强大的Winform Chart图表控件使用说明
- 引言
- 使用说明
- 使用示例
- 资料
引言
以前经常开发网页端的软件,图表组件一般用echart,功能和样式都非常齐全。但是当用winform开发时,类似的组件就很少了,而且稍微好点的都还收费。
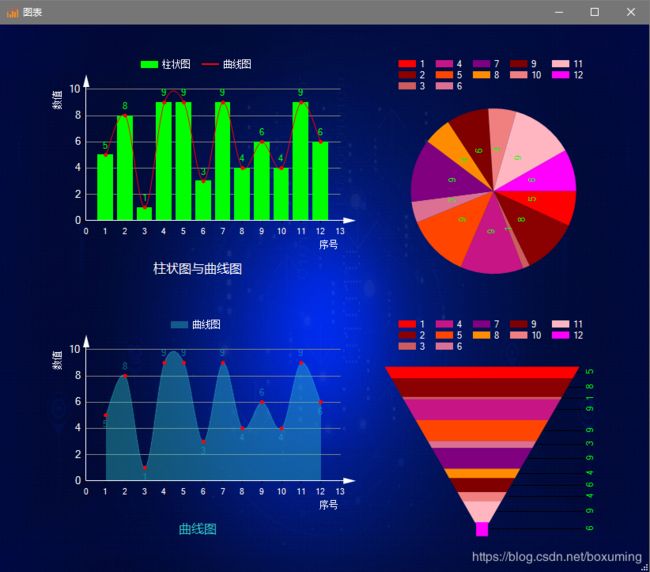
后来探索了下winform自带的 chart控件,发现其功能非常强大,只要你有好看的设计图,基本上都可以按设计图调整出来,下面展示下自己做技术测试的图片:
使用说明
在工具箱-数据分组中我们就可以看到chart控件,使用时拖拽到界面即可。可以通过属性面板设置其样式,也可以通过代码来调整样式。设置的属性可参照:
https://www.cnblogs.com/arxive/p/5861960.html
总结了部分设置chart样式功能的通用类:
	public class ChartHelper
    {
        ///
        /// Name:添加序列
        /// Author:by boxuming 2019-04-28 13:59
        ///
        /// 图表对象
        /// 序列名称
        /// 图表类型
        /// 颜色
        /// 标记点颜色
        /// 是否显示数值
        public static void AddSeries(Chart chart, string seriesName, SeriesChartType chartType, Color color, Color markColor, bool showValue = false)
        {
            chart.Series.Add(seriesName);
            chart.Series[seriesName].ChartType = chartType;
            chart.Series[seriesName].Color = color;
            if (showValue)
            {
                chart.Series[seriesName].IsValueShownAsLabel = true;
                chart.Series[seriesName].MarkerStyle = MarkerStyle.Circle;
                chart.Series[seriesName].MarkerColor = markColor;
                chart.Series[seriesName].LabelForeColor = color;
                chart.Series[seriesName].LabelAngle = -90;
            }
        }

        ///
        /// Name:设置标题
        /// Author:by boxuming 2019-04-28 14:25
        ///
        /// 图表对象
        /// 图表名称
        public static void SetTitle(Chart chart, string chartName, Font font, Docking docking, Color foreColor)
        {
            chart.Titles.Add(chartName);
            chart.Titles[0].Font = font;
            chart.Titles[0].Docking = docking;
            chart.Titles[0].ForeColor = foreColor;
        }

        ///
        /// Name:设置样式
        /// Author:by boxuming 2019-04-23 14:04
        ///
        /// 图表对象
        /// 背景颜色
        /// 字体颜色
        public static void SetStyle(Chart chart, Color backColor, Color foreColor)
        {
            chart.BackColor = backColor;
            chart.ChartAreas[0].BackColor = backColor;
            chart.ForeColor = Color.Red;
        }

        ///
        /// Name:设置图例
        /// Author:by boxuming 2019-04-23 14:30
        ///
        /// 图表对象
        /// 停靠位置
        /// 对齐方式
        /// 背景颜色
        /// 字体颜色
        public static void SetLegend(Chart chart, Docking docking, StringAlignment align, Color backColor, Color foreColor)
        {
            chart.Legends[0].Docking = docking;
            chart.Legends[0].Alignment = align;
            chart.Legends[0].BackColor = backColor;
            chart.Legends[0].ForeColor = foreColor;
        }

        ///
        /// Name:设置XY轴
        /// Author:by boxuming 2019-04-23 14:35
        ///
        /// 图表对象
        /// X轴标题
        /// Y轴标题
        /// 坐标轴标题对齐方式
        /// 坐标轴字体颜色
        /// 坐标轴颜色
        /// 坐标轴箭头样式
        /// X轴的间距
        /// Y轴的间距
        public static void SetXY(Chart chart, string xTitle, string yTitle, StringAlignment align, Color foreColor, Color lineColor, AxisArrowStyle arrowStyle, double xInterval, double yInterval)
        {
            chart.ChartAreas[0].AxisX.Title = xTitle;
            chart.ChartAreas[0].AxisY.Title = yTitle;
            chart.ChartAreas[0].AxisX.TitleAlignment = align;
            chart.ChartAreas[0].AxisY.TitleAlignment = align;
            chart.ChartAreas[0].AxisX.TitleForeColor = foreColor;
            chart.ChartAreas[0].AxisY.TitleForeColor = foreColor;
            chart.ChartAreas[0].AxisX.LabelStyle = new LabelStyle() { ForeColor = foreColor };
            chart.ChartAreas[0].AxisY.LabelStyle = new LabelStyle() { ForeColor = foreColor };
            chart.ChartAreas[0].AxisX.LineColor = lineColor;
            chart.ChartAreas[0].AxisY.LineColor = lineColor;
            chart.ChartAreas[0].AxisX.ArrowStyle = arrowStyle;
            chart.ChartAreas[0].AxisY.ArrowStyle = arrowStyle;
            chart.ChartAreas[0].AxisX.Interval = xInterval;
            chart.ChartAreas[0].AxisY.Interval = yInterval;
        }

        ///
        /// Name:设置网格
        /// Author:by boxuming 2019-04-23 14:55
        ///
        /// 图表对象
        /// 网格线颜色
        /// X轴网格的间距
        /// Y轴网格的间距
        public static void SetMajorGrid(Chart chart, Color lineColor, double xInterval, double yInterval)
        {
            chart.ChartAreas[0].AxisX.MajorGrid.LineColor = lineColor;
            chart.ChartAreas[0].AxisY.MajorGrid.LineColor = lineColor;
            chart.ChartAreas[0].AxisX.MajorGrid.Interval = xInterval;
            chart.ChartAreas[0].AxisY.MajorGrid.Interval = yInterval;
        }
    }
使用示例
文章开头展示的图片中的四个统计图表可通过以下代码实现:
			chart1.Series.Clear();
            ChartHelper.AddSeries(chart1, "柱状图", SeriesChartType.Column, Color.Lime, Color.Red, true);
            ChartHelper.AddSeries(chart1, "曲线图", SeriesChartType.Spline, Color.Red, Color.Red);
            ChartHelper.SetTitle(chart1, "柱状图与曲线图", new Font("微软雅黑", 12), Docking.Bottom, Color.White);
            ChartHelper.SetStyle(chart1, Color.Transparent, Color.White);
            ChartHelper.SetLegend(chart1, Docking.Top, StringAlignment.Center, Color.Transparent, Color.White);
            ChartHelper.SetXY(chart1, "序号", "数值", StringAlignment.Far, Color.White, Color.White, AxisArrowStyle.SharpTriangle, 1, 2);
            ChartHelper.SetMajorGrid(chart1, Color.Gray, 20, 2);

            chart2.Series.Clear();
            ChartHelper.AddSeries(chart2, "饼状图", SeriesChartType.Pie, Color.Lime, Color.Red, true);
            ChartHelper.SetStyle(chart2, Color.Transparent, Color.White);
            ChartHelper.SetLegend(chart2, Docking.Top, StringAlignment.Center, Color.Transparent, Color.White);

            chart3.Series.Clear();
            ChartHelper.AddSeries(chart3, "曲线图", SeriesChartType.SplineRange, Color.FromArgb(100,46, 199, 201), Color.Red, true);
            ChartHelper.SetTitle(chart3, "曲线图", new Font("微软雅黑", 12), Docking.Bottom, Color.FromArgb(46, 199, 201));
            ChartHelper.SetStyle(chart3, Color.Transparent, Color.White);
            ChartHelper.SetLegend(chart3, Docking.Top, StringAlignment.Center, Color.Transparent, Color.White);
            ChartHelper.SetXY(chart3, "序号", "数值", StringAlignment.Far, Color.White, Color.White, AxisArrowStyle.SharpTriangle, 1, 2);
            ChartHelper.SetMajorGrid(chart3, Color.Gray, 20, 2);

            chart4.Series.Clear();
            ChartHelper.AddSeries(chart4, "饼状图", SeriesChartType.Funnel, Color.Lime, Color.Red, true);
            ChartHelper.SetStyle(chart4, Color.Transparent, Color.White);
            ChartHelper.SetLegend(chart4, Docking.Top, StringAlignment.Center, Color.Transparent, Color.White);

			RefreshData();
其中,均是通过调用通用类来进行设置,这样更方便一些。最后的RefreshData()是绑定图表数据的部分,否则没有数据的话图表是无法显示的。绑定数据部分代码如下:
		public void RefreshData()
        {
            List x1 = new List() { 1, 2, 3, 4, 5, 6, 7, 8, 9, 10, 11, 12 };
            List y1 = new List();
            Random ra = new Random();
            y1 = new List() {
                ra.Next(1, 10),
                ra.Next(1, 10),
                ra.Next(1, 10),
                ra.Next(1, 10),
                ra.Next(1, 10),
                ra.Next(1, 10),
                ra.Next(1, 10),
                ra.Next(1, 10),
                ra.Next(1, 10),
                ra.Next(1, 10),
                ra.Next(1, 10),
                ra.Next(1, 10)
            };
            RefreshChart(x1, y1, "chart1");
            RefreshChart(x1, y1, "chart2");
            RefreshChart(x1, y1, "chart3");
            RefreshChart(x1, y1, "chart4");
        }

        public delegate void RefreshChartDelegate(List x, List y, string type);
        public void RefreshChart(List x, List y, string type)
        {
            if (type == "chart1")
            {
                if (this.chart1.InvokeRequired)
                {
                    RefreshChartDelegate stcb = new RefreshChartDelegate(RefreshChart);
                    this.Invoke(stcb, new object[] { x, y, type });
                }
                else
                {
                    chart1.Series[0].Points.DataBindXY(x, y);
                    chart1.Series[1].Points.DataBindXY(x, y);
                }
            }
            else if (type == "chart2")
            {
                if (this.chart2.InvokeRequired)
                {
                    RefreshChartDelegate stcb = new RefreshChartDelegate(RefreshChart);
                    this.Invoke(stcb, new object[] { x, y, type });
                }
                else
                {
                    chart2.Series[0].Points.DataBindXY(x, y);
                    List colors = new List() {
                        Color.Red,
                        Color.DarkRed,
                        Color.IndianRed,
                        Color.MediumVioletRed,
                        Color.OrangeRed,
                        Color.PaleVioletRed,
                        Color.Purple,
                        Color.DarkOrange,
                        Color.Maroon,
                        Color.LightCoral,
                        Color.LightPink,
                        Color.Magenta
                    };
                    DataPointCollection points = chart2.Series[0].Points;
                    for (int i = 0; i < points.Count; i++)
                    {
                        points[i].Color = colors[i];
                    }
                }
            }
            else if (type == "chart3")
            {
                if (this.chart3.InvokeRequired)
                {
                    RefreshChartDelegate stcb = new RefreshChartDelegate(RefreshChart);
                    this.Invoke(stcb, new object[] { x, y, type });
                }
                else
                {
                    chart3.Series[0].Points.DataBindXY(x, y);
                }
            }
            else if (type == "chart4")
            {
                if (this.chart4.InvokeRequired)
                {
                    RefreshChartDelegate stcb = new RefreshChartDelegate(RefreshChart);
                    this.Invoke(stcb, new object[] { x, y, type });
                }
                else
                {
                    chart4.Series[0].Points.DataBindXY(x, y);
                    List colors = new List() {
                        Color.Red,
                        Color.DarkRed,
                        Color.IndianRed,
                        Color.MediumVioletRed,
                        Color.OrangeRed,
                        Color.PaleVioletRed,
                        Color.Purple,
                        Color.DarkOrange,
                        Color.Maroon,
                        Color.LightCoral,
                        Color.LightPink,
                        Color.Magenta
                    };
                    DataPointCollection points = chart4.Series[0].Points;
                    for (int i = 0; i < points.Count; i++)
                    {
                        points[i].Color = colors[i];
                    }
                }
            }
        }
为了让图表展现动画效果,添加了一个定时器,用来实时改变数据,这样就可以看到动起来的图表了。定时器代码如下:
		private void Timer1_Tick(object sender, EventArgs e)
        {
            new Thread(new ThreadStart(RefreshData)).Start();
        }
资料
以上只是使用chart控件的几个简单示例,而chart控件的功能远远不止这些。为了更方便地了解和使用其他功能,特提供了一些资料,其中包括图表的属性说明文档、各类图表的样式和对应的代码、以及程序示例等,下载地址如下:
链接:https://pan.baidu.com/s/1mCxiwrEBxeCKkSltXMJPpA
提取码:9pgr