【Grafana】CentOS部署Grafana配置nginx反向代理域名访问
CentOS部署Grafana配置nginx反向代理域名访问
什么是Grafana
The open platform for beautiful
analytics and monitoring
Grafana是开源的数据可视化工具,目前支持
- 57种数据源
- 51种面板
- 17种APP
- 1963种仪表盘
到目前为止,Grafana的版本为v6.2
我们可以用Grafana来做业务数据的数据可视化,服务器数据的监控以及警告。
安装Grafana
官网几乎支持全部平台的安装,包括
- Debian / Ubuntu
- CentOS, Fedora, OpenSuse, RedHat
- Windows
- Mac
- Docker
- 源码编译
我用的服务器为CentOS,以下为安装过程。
下载文件
wget https://dl.grafana.com/oss/release/grafana-6.2.5-1.x86_64.rpm
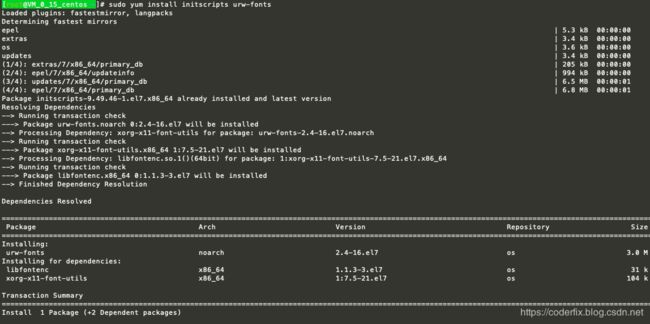
sudo yum install initscripts urw-fonts
sudo rpm -Uvh grafana-6.2.5-1.x86_64.rpm
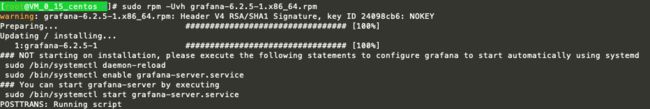
Preparing...                          ################################# [100%]
Updating / installing...
   1:grafana-6.2.5-1                  ################################# [100%]
### NOT starting on installation, please execute the following statements to configure grafana to start automatically using systemd
sudo /bin/systemctl daemon-reload
sudo /bin/systemctl enable grafana-server.service
### You can start grafana-server by executing
sudo /bin/systemctl start grafana-server.service
修改配置文件
我们是通过rpm安装的,所以配置文件的位置在/etc/grafana/grafana.ini
下面是完整的配置文件,需要改哪里就修改哪里,现在先不都一一讲解,需要的时候再去看对应的部分就可以。
##################### Grafana Configuration Example #####################
#
# Everything has defaults so you only need to uncomment things you want to
# change
# possible values : production, development
;app_mode = production
# instance name, defaults to HOSTNAME environment variable value or hostname if HOSTNAME var is empty
;instance_name = ${HOSTNAME}
#################################### Paths ####################################
[paths]
# Path to where grafana can store temp files, sessions, and the sqlite3 db (if that is used)
;data = /var/lib/grafana
# Temporary files in `data` directory older than given duration will be removed
;temp_data_lifetime = 24h
# Directory where grafana can store logs
;logs = /var/log/grafana
# Directory where grafana will automatically scan and look for plugins
;plugins = /var/lib/grafana/plugins
# folder that contains provisioning config files that grafana will apply on startup and while running.
;provisioning = conf/provisioning
#################################### Server ####################################
[server]
# Protocol (http, https, socket)
;protocol = http
# The ip address to bind to, empty will bind to all interfaces
;http_addr =
# The http port to use
;http_port = 3000
# The public facing domain name used to access grafana from a browser
;domain = localhost
# Redirect to correct domain if host header does not match domain
# Prevents DNS rebinding attacks
;enforce_domain = false
# The full public facing url you use in browser, used for redirects and emails
# If you use reverse proxy and sub path specify full url (with sub path)
;root_url = http://localhost:3000
# Log web requests
;router_logging = false
# the path relative working path
;static_root_path = public
# enable gzip
;enable_gzip = false
# https certs & key file
;cert_file =
;cert_key =
# Unix socket path
;socket =
#################################### Database ####################################
[database]
# You can configure the database connection by specifying type, host, name, user and password
# as separate properties or as on string using the url properties.
# Either "mysql", "postgres" or "sqlite3", it's your choice
;type = sqlite3
;host = 127.0.0.1:3306
;name = grafana
;user = root
# If the password contains # or ; you have to wrap it with triple quotes. Ex """#password;"""
;password =
# Use either URL or the previous fields to configure the database
# Example: mysql://user:secret@host:port/database
;url =
# For "postgres" only, either "disable", "require" or "verify-full"
;ssl_mode = disable
# For "sqlite3" only, path relative to data_path setting
;path = grafana.db
# Max idle conn setting default is 2
;max_idle_conn = 2
# Max conn setting default is 0 (mean not set)
;max_open_conn =
# Connection Max Lifetime default is 14400 (means 14400 seconds or 4 hours)
;conn_max_lifetime = 14400
# Set to true to log the sql calls and execution times.
log_queries =
# For "sqlite3" only. cache mode setting used for connecting to the database. (private, shared)
;cache_mode = private
#################################### Cache server #############################
[remote_cache]
# Either "redis", "memcached" or "database" default is "database"
;type = database
# cache connectionstring options
# database: will use Grafana primary database.
# redis: config like redis server e.g. `addr=127.0.0.1:6379,pool_size=100,db=0`. Only addr is required.
# memcache: 127.0.0.1:11211
;connstr =
#################################### Data proxy ###########################
[dataproxy]
# This enables data proxy logging, default is false
;logging = false
# How long the data proxy should wait before timing out default is 30 (seconds)
;timeout = 30
# If enabled and user is not anonymous, data proxy will add X-Grafana-User header with username into the request, default is false.
;send_user_header = false
#################################### Analytics ####################################
[analytics]
# Server reporting, sends usage counters to stats.grafana.org every 24 hours.
# No ip addresses are being tracked, only simple counters to track
# running instances, dashboard and error counts. It is very helpful to us.
# Change this option to false to disable reporting.
;reporting_enabled = true
# Set to false to disable all checks to https://grafana.net
# for new vesions (grafana itself and plugins), check is used
# in some UI views to notify that grafana or plugin update exists
# This option does not cause any auto updates, nor send any information
# only a GET request to http://grafana.com to get latest versions
;check_for_updates = true
# Google Analytics universal tracking code, only enabled if you specify an id here
;google_analytics_ua_id =
# Google Tag Manager ID, only enabled if you specify an id here
;google_tag_manager_id =
#################################### Security ####################################
[security]
# default admin user, created on startup
;admin_user = admin
# default admin password, can be changed before first start of grafana, or in profile settings
;admin_password = admin
# used for signing
;secret_key = SW2YcwTIb9zpOOhoPsMm
# disable gravatar profile images
;disable_gravatar = false
# data source proxy whitelist (ip_or_domain:port separated by spaces)
;data_source_proxy_whitelist =
# disable protection against brute force login attempts
;disable_brute_force_login_protection = false
# set to true if you host Grafana behind HTTPS. default is false.
;cookie_secure = false
# set cookie SameSite attribute. defaults to `lax`. can be set to "lax", "strict" and "none"
;cookie_samesite = lax
# set to true if you want to allow browsers to render Grafana in a ,