QCustomPlot介绍及实例
QCustomPlot 是一个小巧好用的 QT 图表插件。用来画曲线图、趋势图、坐标图、柱状图等类似二维图的库。实现大部分的2维图形绘制。使用时,我们在程序中写完相关调用的代码后,只需将 QCunstomPlot.cpp 和 QCustomPlot.h 两个文件加入工程,正常编译即可,有GPL的授权,支持跨平台的C/C++语言 。
QCustomPlot给我们提供了非常方便的加载数据的接口:setData() 和 addData()。
QCustomPlot采用了大量的技术比如自适应采样和文本对象缓存为了减少replot的时间。然而一些特性比如半透明的填充,反锯齿和粗线条都可能导致低效率。如果你在你的程序中注意到了这些。这有一些提示关于如何跳高Replot的性能。
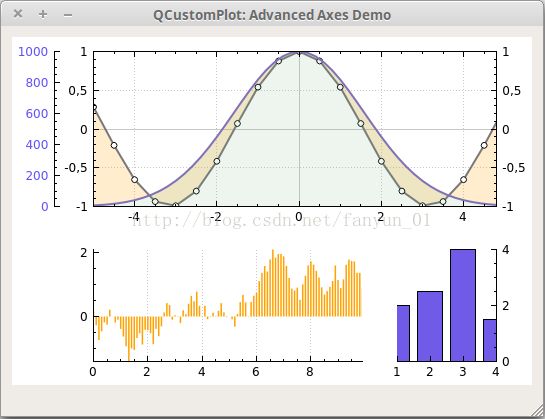
下面给出常用的统计图和K线图的示例:
  customPlot->plotLayout()->clear();
  QCPAxisRect *wideAxisRect = new QCPAxisRect(customPlot);
  wideAxisRect->setupFullAxesBox(true);
  wideAxisRect->axis(QCPAxis::atRight, 0)->setTickLabels(true);
  wideAxisRect->addAxis(QCPAxis::atLeft)->setTickLabelColor(QColor("#6050F8"));
  QCPLayoutGrid *subLayout = new QCPLayoutGrid;
  customPlot->plotLayout()->addElement(0, 0, wideAxisRect);
  customPlot->plotLayout()->addElement(1, 0, subLayout);
  QCPAxisRect *subRectLeft = new QCPAxisRect(customPlot, false);
  QCPAxisRect *subRectRight = new QCPAxisRect(customPlot, false);
  subLayout->addElement(0, 0, subRectLeft);
  subLayout->addElement(0, 1, subRectRight);
  subRectRight->setMaximumSize(150, 150);
  subRectRight->setMinimumSize(150, 150);
  subRectLeft->addAxes(QCPAxis::atBottom | QCPAxis::atLeft);
  subRectRight->addAxes(QCPAxis::atBottom | QCPAxis::atRight);
  subRectLeft->axis(QCPAxis::atLeft)->ticker()->setTickCount(2);
  subRectRight->axis(QCPAxis::atRight)->ticker()->setTickCount(2);
  subRectRight->axis(QCPAxis::atBottom)->ticker()->setTickCount(2);
  subRectLeft->axis(QCPAxis::atBottom)->grid()->setVisible(true);
  QCPMarginGroup *marginGroup = new QCPMarginGroup(customPlot);
  subRectLeft->setMarginGroup(QCP::msLeft, marginGroup);
  subRectRight->setMarginGroup(QCP::msRight, marginGroup);
  wideAxisRect->setMarginGroup(QCP::msLeft | QCP::msRight, marginGroup);
  foreach (QCPAxisRect *rect, customPlot->axisRects())
  {
    foreach (QCPAxis *axis, rect->axes())
    {
      axis->setLayer("axes");
      axis->grid()->setLayer("grid");
    }
  }

  QVector dataCos(21), dataGauss(50), dataRandom(100);
  QVector x3, y3;
  qsrand(3);
  for (int i=0; iaddGraph(wideAxisRect->axis(QCPAxis::atBottom), wideAxisRect->axis(QCPAxis::atLeft));
  mainGraphCos->data()->set(dataCos);
  mainGraphCos->valueAxis()->setRange(-1, 1);
  mainGraphCos->rescaleKeyAxis();
  mainGraphCos->setScatterStyle(QCPScatterStyle(QCPScatterStyle::ssCircle, QPen(Qt::black), QBrush(Qt::white), 6));
  mainGraphCos->setPen(QPen(QColor(120, 120, 120), 2));
  QCPGraph *mainGraphGauss = customPlot->addGraph(wideAxisRect->axis(QCPAxis::atBottom), wideAxisRect->axis(QCPAxis::atLeft, 1));
  mainGraphGauss->data()->set(dataGauss);
  mainGraphGauss->setPen(QPen(QColor("#8070B8"), 2));
  mainGraphGauss->setBrush(QColor(110, 170, 110, 30));
  mainGraphCos->setChannelFillGraph(mainGraphGauss);
  mainGraphCos->setBrush(QColor(255, 161, 0, 50));
  mainGraphGauss->valueAxis()->setRange(0, 1000);
  mainGraphGauss->rescaleKeyAxis();

  QCPGraph *subGraphRandom = customPlot->addGraph(subRectLeft->axis(QCPAxis::atBottom), subRectLeft->axis(QCPAxis::atLeft));
  subGraphRandom->data()->set(dataRandom);
  subGraphRandom->setLineStyle(QCPGraph::lsImpulse);
  subGraphRandom->setPen(QPen(QColor("#FFA100"), 1.5));
  subGraphRandom->rescaleAxes();

  QCPBars *subBars = new QCPBars(subRectRight->axis(QCPAxis::atBottom), subRectRight->axis(QCPAxis::atRight));
  subBars->setWidth(3/(double)x3.size());
  subBars->setData(x3, y3);
  subBars->setPen(QPen(Qt::black));
  subBars->setAntialiased(false);
  subBars->setAntialiasedFill(false);
  subBars->setBrush(QColor("#705BE8"));
  subBars->keyAxis()->setSubTicks(false);
  subBars->rescaleAxes();

  QSharedPointer intTicker(new QCPAxisTickerFixed);
  intTicker->setTickStep(1.0);
  intTicker->setScaleStrategy(QCPAxisTickerFixed::ssMultiples);
subBars->keyAxis()->setTicker(intTicker); K线图代码:
customPlot->legend->setVisible(true);

int n = 500;
QVector time(n), value1(n), value2(n);
QDateTime start = QDateTime(QDate(2014, 6, 11));
start.setTimeSpec(Qt::UTC);
double startTime = start.toTime_t();
double binSize = 3600*24;
value1[0] = 60;
value2[0] = 20;
qsrand(9);
for (int i=1; ixAxis, customPlot->yAxis);
candlesticks->setName("Candlestick");
candlesticks->setChartStyle(QCPFinancial::csCandlestick);
candlesticks->data()->set(QCPFinancial::timeSeriesToOhlc(time, value1, binSize, startTime));
candlesticks->setWidth(binSize*0.9);
candlesticks->setTwoColored(true);
candlesticks->setBrushPositive(QColor(245, 245, 245));
candlesticks->setBrushNegative(QColor(40, 40, 40));
candlesticks->setPenPositive(QPen(QColor(0, 0, 0)));
candlesticks->setPenNegative(QPen(QColor(0, 0, 0)));

QCPFinancial *ohlc = new QCPFinancial(customPlot->xAxis, customPlot->yAxis);
ohlc->setName("OHLC");
ohlc->setChartStyle(QCPFinancial::csOhlc);
ohlc->data()->set(QCPFinancial::timeSeriesToOhlc(time, value2, binSize/3.0, startTime));
ohlc->setWidth(binSize*0.2);
ohlc->setTwoColored(true);

QCPAxisRect *volumeAxisRect = new QCPAxisRect(customPlot);
customPlot->plotLayout()->addElement(1, 0, volumeAxisRect);
volumeAxisRect->setMaximumSize(QSize(QWIDGETSIZE_MAX, 100));
volumeAxisRect->axis(QCPAxis::atBottom)->setLayer("axes");
volumeAxisRect->axis(QCPAxis::atBottom)->grid()->setLayer("grid");
// bring bottom and main axis rect closer together:
customPlot->plotLayout()->setRowSpacing(0);
volumeAxisRect->setAutoMargins(QCP::msLeft|QCP::msRight|QCP::msBottom);
volumeAxisRect->setMargins(QMargins(0, 0, 0, 0));
// create two bar plottables, for positive (green) and negative (red) volume bars:
customPlot->setAutoAddPlottableToLegend(false);
QCPBars *volumePos = new QCPBars(volumeAxisRect->axis(QCPAxis::atBottom), volumeAxisRect->axis(QCPAxis::atLeft));
QCPBars *volumeNeg = new QCPBars(volumeAxisRect->axis(QCPAxis::atBottom), volumeAxisRect->axis(QCPAxis::atLeft));
for (int i=0; iaddData(startTime+3600*5.0*i, qAbs(v));
volumePos->setWidth(3600*4);
volumePos->setPen(Qt::NoPen);
volumePos->setBrush(QColor(100, 180, 110));
volumeNeg->setWidth(3600*4);
volumeNeg->setPen(Qt::NoPen);
volumeNeg->setBrush(QColor(180, 90, 90));

// interconnect x axis ranges of main and bottom axis rects:
connect(customPlot->xAxis, SIGNAL(rangeChanged(QCPRange)), volumeAxisRect->axis(QCPAxis::atBottom), SLOT(setRange(QCPRange)));
connect(volumeAxisRect->axis(QCPAxis::atBottom), SIGNAL(rangeChanged(QCPRange)), customPlot->xAxis, SLOT(setRange(QCPRange)));
// configure axes of both main and bottom axis rect:
QSharedPointer dateTimeTicker(new QCPAxisTickerDateTime);
dateTimeTicker->setDateTimeSpec(Qt::UTC);
dateTimeTicker->setDateTimeFormat("dd. MMMM");
volumeAxisRect->axis(QCPAxis::atBottom)->setTicker(dateTimeTicker);
volumeAxisRect->axis(QCPAxis::atBottom)->setTickLabelRotation(15);
customPlot->xAxis->setBasePen(Qt::NoPen);
customPlot->xAxis->setTickLabels(false);
customPlot->xAxis->setTicks(false);
customPlot->xAxis->setTicker(dateTimeTicker);
customPlot->rescaleAxes();
customPlot->xAxis->scaleRange(1.025, customPlot->xAxis->range().center());
customPlot->yAxis->scaleRange(1.1, customPlot->yAxis->range().center());

QCPMarginGroup *group = new QCPMarginGroup(customPlot);
customPlot->axisRect()->setMarginGroup(QCP::msLeft|QCP::msRight, group);
volumeAxisRect->setMarginGroup(QCP::msLeft|QCP::msRight, group);
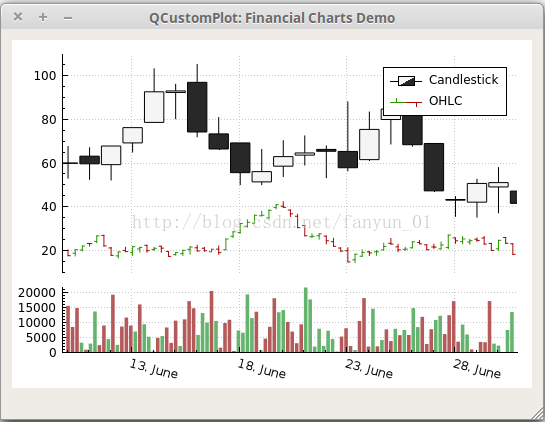
K线图如图1-2所示:
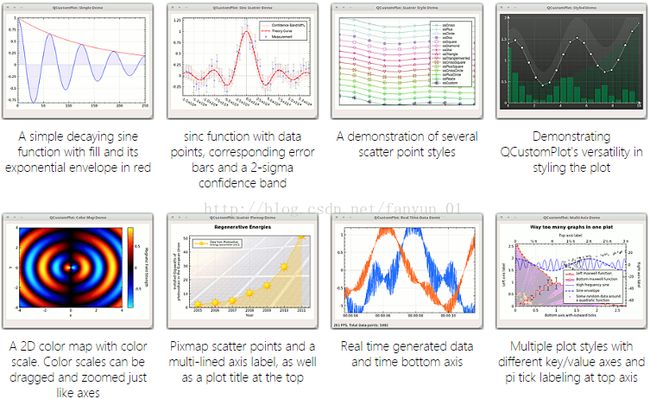
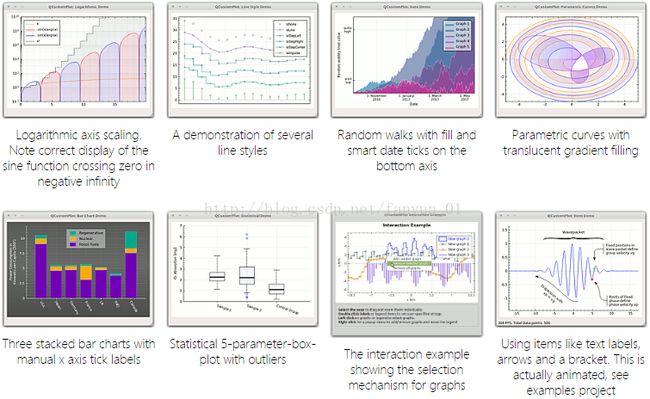
图1-2 K线图其它绘图效果如下所示:


