ASP.NET MVC+HighCharts开发统计图表

HighCharts是开源的Web图表js组件,与D3.js一样,经常用于数据可视化。HighCharts图表类型丰富,功能非常强大,是很好的数据可视化解决方案,其官方网站为:http://www.hcharts.cn/,感兴趣的读者可以自行去下载HighCharts并按照给出的Example尝试着开发,基本上按照示例中的例子,把数据部分替换成自己想要展示的数据就可以了,非常容易上手。本篇博客将结合ASP.NET MVC和HighCharts开发统计图表功能,为简单起见,这里只演示三个最基本、最常用的图表类型(柱状图、饼图)。

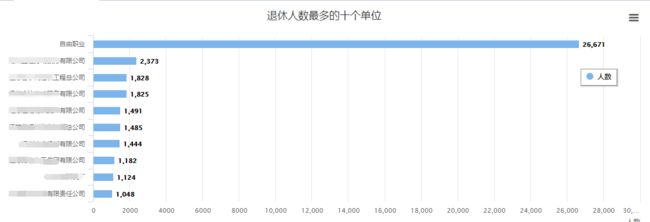
一、横向柱状图
ASP.NET MVC+HighCharts开发统计图表_第1张图片
前端cshtml代码:

@{
    Layout = null;
}


    退休单位统计


控制器cs代码:

/// 
/// 退休单位统计
/// 
/// 
[HttpGet]
public string GetTXDW()
{
    string result1 = string.Empty;
    string result2 = string.Empty;
    string sql = @"with a as(select rownum rn,t.* from(
select gzdw,count(gzdw) xl from T_RYXX 
group by gzdw
order by xl desc) t)
select gzdw,xl from a where a.rn>=1 and a.rn<=10";

    result1 += "[";
    result2 += "[";
    DataSet ds = OracleHelper.Query(sql);
    for (int i = 0; i < ds.Tables[0].Rows.Count; i++)
    {
        result1 += "'" + ds.Tables[0].Rows[i]["GZDW"].ToString() + "'";
        result2 += ds.Tables[0].Rows[i]["XL"].ToString();
        if (i != ds.Tables[0].Rows.Count - 1)
        {
            result1 += ",";
            result2 += ",";
        }
    }
    result1 += "]";
    result2 += "]";
    return result1 + ";" + result2;
}

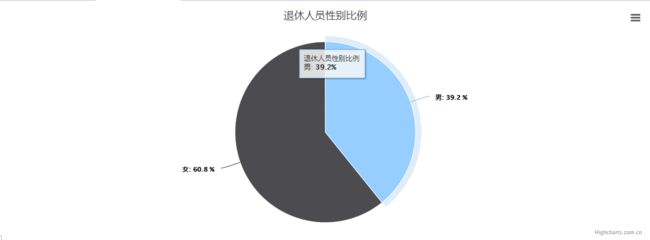
二、饼图
ASP.NET MVC+HighCharts开发统计图表_第2张图片
前端cshtml代码:

@{
    Layout = null;
}


    性别统计


控制器cs代码:

/// 
/// 性别统计
/// 
/// 
[HttpGet]
public string GetXBTJ()
{
    string result = string.Empty;
    string sql = @"with a as(select substr((case when length(sfzhm)=15 then idcard15to18(sfzhm)
else sfzhm end),17,1) sfzhm
from T_RYXX 
where regexp_replace(sfzhm,'^[-\+]?\d+(\.\d+)?$','') is null
order by to_number(dah))

select t.xb,count(t.xb) xl from (
select (case when mod(to_number(sfzhm),2)=0 then '女' else '男' end) xb from a) t
group by t.xb";
    DataSet ds = OracleHelper.Query(sql);
    result += "[";
    for (int i = 0; i < ds.Tables[0].Rows.Count; i++)
    {
        result += "[";
        result += "'" + ds.Tables[0].Rows[i]["XB"].ToString() + "'";
        result += ",";
        result += ds.Tables[0].Rows[i]["XL"].ToString();
        result += "]";
        if (i != ds.Tables[0].Rows.Count - 1)
        {
            result += ",";
        }
    }
    result += "]";
    return result;
}

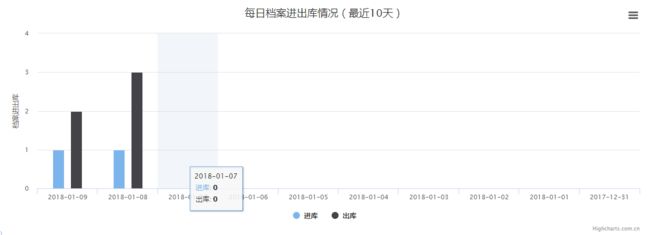
三、纵向柱状图
ASP.NET MVC+HighCharts开发统计图表_第3张图片
前端cshtml代码:

@{
    Layout = null;
}


    每日进出库统计


控制器cs代码:

/// 
/// 进出库统计
/// 
/// 
[HttpGet]
public string GETJCK()
{
    string result1 = string.Empty;
    string result2 = string.Empty;
    string result3 = string.Empty;
    string sql = @"with a as(select to_char(czsj,'yyyy-mm-dd') jysj,count(*) jyxl 
from t_dajy 
where to_char(czsj,'yyyy-mm-dd')>to_char(sysdate-10,'yyyy-mm-dd')
group by to_char(czsj,'yyyy-mm-dd')),

b as(select to_char(ghsj,'yyyy-mm-dd') ghsj,count(*) ghxl
from t_dagh 
where to_char(ghsj,'yyyy-mm-dd')>to_char(sysdate-10,'yyyy-mm-dd')
group by to_char(ghsj,'yyyy-mm-dd')),

c as(select 
to_char(to_date(to_char(sysdate,'yyyy-mm-dd'),'yyyy-mm-dd') -rownum+1,'yyyy-mm-dd') as d from dual
connect by rownum <=to_date(to_char(sysdate,'yyyy-mm-dd'),'yyyy-mm-dd')
-to_date(to_char(sysdate-10,'yyyy-mm-dd'),'yyyy-mm-dd'))

select c.d,(case when a.jyxl is null then 0 else a.jyxl end) jyxl,
(case when b.ghxl is null then 0 else b.ghxl end) ghxl from c 
left join a on a.jysj = c.d
left join b on b.ghsj = c.d
order by d desc";
    result1 += "[";
    result2 += "[";
    result3 += "[";
    DataSet ds = OracleHelper.Query(sql);
    for (int i = 0; i < ds.Tables[0].Rows.Count; i++)
    {
        result1 += "'" + ds.Tables[0].Rows[i]["D"].ToString() + "'";
        result2 += ds.Tables[0].Rows[i]["JYXL"].ToString();
        result3 += ds.Tables[0].Rows[i]["GHXL"].ToString();

        if (i != ds.Tables[0].Rows.Count - 1)
        {
            result1 += ",";
            result2 += ",";
            result3 += ",";
        }
    }
    result1 += "]";
    result2 += "]";
    result3 += "]";
    return result1 + ";" + result2 + ";" + result3;
}

你可能感兴趣的:(.net,.NET,In,Action)