python实战计划的第十个项目:绘制发帖量的折线图。
- 具体的任务:
绘制武昌、洪山、江岸三个地区分别在1月份-7月份的发帖量的折线图。
我们先来看一下基本的折线图,以及代码的基本格式。
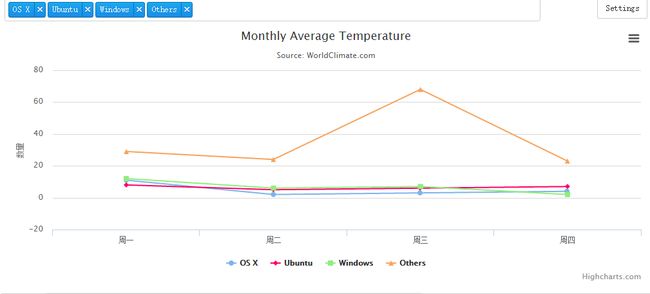
a1.png
options = {
    'chart'   : {'zoomType':'xy'},
    'title'   : {'text': 'Monthly Average Temperature'},  #标题
    'subtitle': {'text': 'Source: WorldClimate.com'},    #小标题
    'xAxis'   : {'categories': ['周一', '周二', '周三', '周四']}, #x轴
    'yAxis'   : {'title': {'text': '数量'}}                      #y轴
    }

series = [
    {
    'name': 'OS X',
    'data': [11,2,3,4],
    'type': 'line',
    'y':5
}, {
    'name': 'Ubuntu',
    'data': [8,5,6,7],
    'type': 'line',
    'color':'#ff0066'
}, {
    'name': 'Windows',
    'data': [12,6,7,2],
    'type': 'line'
}, {
    'name': 'Others',
    'data': [29,24,68,23],
    'type': 'line'
}
         ]

charts.plot(series, options=options,show='inline')
# options=dict(title=dict(text='Charts are AWESOME!!!'))
1.任务开始之前,我们先看两个函数
- 自定义的get_all_dates()函数,作用看它的输入与输出就能明白。
def get_all_dates(date1,date2):
    the_date = date(int(date1.split('.')[0]),int(date1.split('.')[1]),int(date1.split('.')[2]))
    end_date = date(int(date2.split('.')[0]),int(date2.split('.')[1]),int(date2.split('.')[2]))
    days = timedelta(days=1)

    while the_date <= end_date:
        yield (the_date.strftime('%Y.%m.%d'))
        the_date = the_date + days
for i in get_all_dates('2015.12.24','2016.01.05'):
    print(i)

# 2015.12.24
# 2015.12.25
# 2015.12.26
# 2015.12.27
# 2015.12.28
# 2015.12.29
# 2015.12.30
# 2015.12.31
# 2016.01.01
# 2016.01.02
# 2016.01.03
# 2016.01.04
# 2016.01.05
- 自定义get_data_within函数
这个函数接收三个参数,第一个是起始时间,第二个是截至时间,第三个是地区项。
def get_data_within(date1,date2,areas):
    for area in areas:        # 任务可传areas参数['武昌','洪山','江岸']
        area_month_posts = []   # 创建一个列表,时间段内的发帖数量装进这个列表中
        for date in get_all_dates(date1,date2):
            a = list(item_info.find({'pub_date':date,'area':area}))
            each_month_post = len(a)
            area_month_posts.append(each_month_post)
        data = {
            'name': area,
            'data': area_month_posts,
            'type': 'line'
        }
        yield data
然后调用
for i in get_data_within('2015.12.24','2016.01.05',['朝阳','海淀','通州']):
    print(i)
我们就可以得到:
{'data': [220, 217, 259, 266, 322, 287, 309, 307, 346, 440, 488, 641, 649], 'type': 'line', 'name': '朝阳'}
{'data': [137, 146, 154, 156, 176, 183, 171, 217, 239, 284, 288, 397, 395], 'type': 'line', 'name': '海淀'}
{'data': [58, 54, 74, 57, 82, 84, 93, 79, 114, 113, 133, 151, 201], 'type': 'line', 'name': '通州'}
整理成要的数据结构:
options = {
    'chart'   : {'zoomType':'xy'},
    'title'   : {'text': '发帖量统计'},
    'subtitle': {'text': '可视化统计图表'},
    'xAxis'   : {'categories': [i for i in get_all_dates('2015.12.24','2016.01.05')]},
    'yAxis'   : {'title': {'text': '数量'}}
    }

series = [i for i in get_data_within('2015.12.24','2016.01.05',['朝阳','海淀','通州'])]

charts.plot(series, options=options,show='inline')
# options=dict(title=dict(text='Charts are AWESOME!!!'))

a2.png
2.任务开始
任务失败!!!