HINT /*+ monitor */和 dbms_sqltune.report_sql_monitor连用
场景:有些SQL,运行好几十分或超一个钟,当你用explain plan for去查看时正常,但在实际执行的时候却相当的慢,尤其要运行超过1个钟,几个钟的SQL,难以等待,不能及时掌握其运行情况;
而/*+ monitor */和 dbms_sqltune.report_sql_monitor可以观察正在运行的实时SQL的执行计划情况;
Oracle Database 11g: Real-Time SQL Monitoring
Real-Time SQL Monitoring, introduced in Oracle Database 11g, provides a very effective way to identify run-time performance problems with resource intensive long-running and parallel SQL statements. Interactive Enterprise Manager screens display details of SQL execution using new, fine-grained SQL statistic that are tracked out-of-the-box with no performance penalty to production systems. Statistics at each step of the execution plan are tracked by key performance metrics, including elapsed time, CPU time, number of reads and writes, I/O wait time and various other wait times. This allows DBAs to analyze SQL execution more deeply than previously possible and decide on the most appropriate tuning strategies for monitored SQL statements.
MONITOR Hint
The MONITOR hint forces real-time SQL monitoring for the query, even if the statement
is not long running. This hint is valid only when the parameter CONTROL_MANAGEMENT_PACK_ACCESS is set to DIAGNOSTIC+TUNING.
SQL> show parameter CONTROL_MANAGEMENT_PACK_ACCESS;
control_management_pack_access string DIAGNOSTIC+TUNING
The real-time SQL monitoring feature of Oracle Database enables you to monitor the performance of SQL statements while they are executing. By default, SQL monitoring automatically starts when a SQL statement runs parallel, or when it has consumed at least 5 seconds of CPU or I/O time in a single execution.
当SQL以并行方式或者单独运行占用CPU或IO的时间超过5秒钟就会自动被ORACLE启用监视;
例1
select /*+ parallel(8) */count(1) from test where object_id=99;
执行后可以马上在v$sql_monitor中看到并行的信息;
STATUS USERNAME MODULE PROGRAM SQL_ID SQL_TEXT
1 EXECUTING 8q4t38pwpx829
2 EXECUTING 8q4t38pwpx829
3 EXECUTING 8q4t38pwpx829
4 EXECUTING 8q4t38pwpx829
5 EXECUTING 8q4t38pwpx829
6 EXECUTING 8q4t38pwpx829
7 EXECUTING AIKI SQL*Plus [email protected] (TNS V1-V3) 8q4t38pwpx829 select /*+ parallel(8) */count(1) from test where object_id=99
8 EXECUTING 8q4t38pwpx829
9 EXECUTING 8q4t38pwpx829
例2,当一个SQL的运行时间不够5秒时候,O是默认不监控;超过5秒钟时O是会自动记录其相关的统计内容;
SQL> select count(1) from dba_objects;
72730
Elapsed: 00:00:00.09
SQL> select count(1) from v$sql_monitor where upper(sql_text) like upper('select count(1) from dba_objects');
0
SQL> select count(1) from test where object_id=100;
256
Elapsed: 00:00:55.00
SQL> select count(1) from v$sql_monitor where upper(sql_text) like upper('select count(1) from test where object_id=100');
1
如何来统计不到5秒的SQL,这就要用到HINT;
SQL> select /*+ monitor */count(1) from dba_objects;
72730
Elapsed: 00:00:00.30
已经可以看到结果了;
select status,username,module,program,sql_id,sql_text from V$SQL_MONITOR order by sql_exec_start desc
STATUS USERNAME MODULE PROGRAM SQL_ID SQL_TEXT
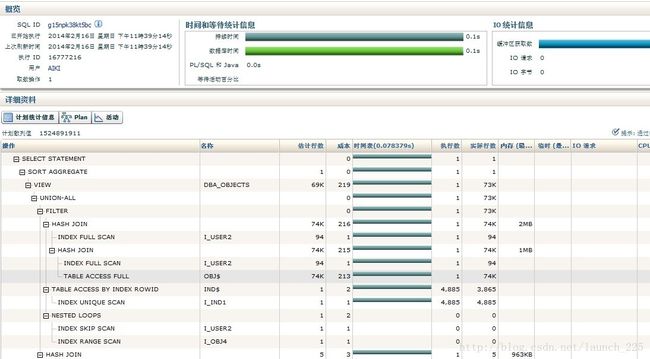
1 DONE (ALL ROWS) AIKI SQL*Plus [email protected] (TNS V1-V3) g15npk38kt5bc select /*+ monitor */count(1) from dba_objects
如何来生成报告呢?这就要用到dbms_sqltune.report_sql_monitor,相关的参数可以参见文档
set trimspool on
set trim on
set pages 0
set linesize 1000
set long 1000000
set longchunksize 1000000
CRT->菜单(文件)->记录会话 ->保存为08.html
执行select dbms_sqltune.report_sql_monitor(sql_id=>'g15npk38kt5bc',type=>'ACTIVE') from dual;
->停止记录
打开08.html
官方地址:http://www.oracle.com/technetwork/database/manageability/sqlmonitor-084401.html
