Matplotlib可视化常用操作集合
Matplotlib常用操作
记录写代码过程中常遇到的关于绘图的问题以及基本功能,能够满足日常需求
使用时其他细节可使用help,或查阅官方文档
Matplotlib可视化常用操作集合
- Matplotlib常用操作
- 普通绘制折线图
- 线型与颜色
- 设置标题
- 设置图例
- 设置坐标轴
- 图的背景线
- 绘制子图
- 坐标线的颜色及位置
- 设置标注
- 控制子图的间距
- 绘制其他图形
- 绘制条形图
- 绘制箱形图
- 终端使用
- 其余经常遇到的
- 显示灰度图
- 显示颜色条
import matplotlib
import matplotlib.pyplot as plt
import numpy as np
普通绘制折线图
- plt.figure创建一个画布
- figsize设置画布大小
- facecolor设置画布背景色
plt.figure(figsize=[6,4], facecolor='y')
plt.plot([1,2,3], [1,2,3])
plt.show()
线型与颜色
-
线型 linestyle
========== ===============================
character description
========== ===============================
'-'solid line style
'--'dashed line style
'-.'dash-dot line style
':'dotted line style
'.'point marker
','pixel marker
'o'circle marker
'v'triangle_down marker
'^'triangle_up marker
'<'triangle_left marker
'>'triangle_right marker
'1'tri_down marker
'2'tri_up marker
'3'tri_left marker
'4'tri_right marker
's'square marker
'p'pentagon marker
'*'star marker
'h'hexagon1 marker
'H'hexagon2 marker
'+'plus marker
'x'x marker
'D'diamond marker
'd'thin_diamond marker
'|'vline marker
'_'hline marker
======== =============================== -
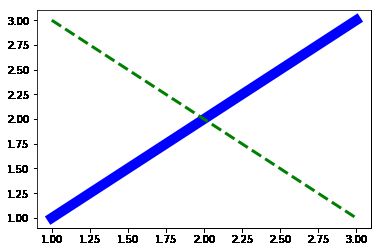
线宽 linewidth 使用数字
-
颜色 color
========== ========
character color
========== ========
bblue
ggreen
rred
ccyan
mmagenta
yyellow
kblack
wwhite
========== ========
plt.figure()
plt.plot([1,2,3], [1,2,3], 'b-', linewidth=10)
plt.plot([1,2,3], [3,2,1], linestyle='--', color='g', linewidth=3)
plt.show()
设置标题
-
fontsize设置字体大小,默认12,可选参数 [‘xx-small’, ‘x-small’, ‘small’, ‘medium’, ‘large’,‘x-large’, ‘xx-large’]
-
fontweight设置字体粗细,可选参数 [‘light’, ‘normal’, ‘medium’, ‘semibold’, ‘bold’, ‘heavy’, ‘black’]
-
fontstyle设置字体类型,可选参数[ ‘normal’ | ‘italic’ | ‘oblique’ ],italic斜体,oblique倾斜
-
verticalalignment设置水平对齐方式 ,可选参数 : ‘center’ , ‘top’ , ‘bottom’ ,‘baseline’
-
horizontalalignment设置垂直对齐方式,可选参数:left,right,center
-
rotation(旋转角度)可选参数为:vertical,horizontal 也可以为数字
-
alpha透明度,参数值0至1之间
-
backgroundcolor标题背景颜色
-
loc设置标题位置,可选参数[‘left’, ‘center’, ‘right’]
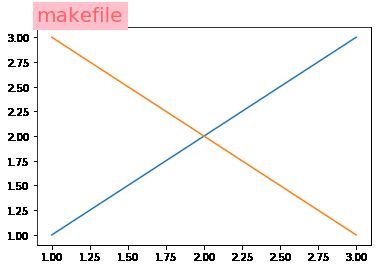
plt.figure()
plt.plot([1,2,3], [1,2,3])
plt.plot([1,2,3], [3,2,1])
plt.title('makefile', fontsize=20, color='red', loc='left', alpha=0.5, rotation=0, backgroundcolor='pink')
plt.show()
设置图例
legend((line1, line2, line3), (‘label1’, ‘label2’, ‘label3’))
line1-3表示每个例子
一般地,可以直接legend([‘label1’, ‘label2’])
-
loc设置图例位置,可选参数0-10
- 0:‘best
- 1:‘upper right‘
- 2:‘upper left’
- 3:‘lower left’
- 4:‘lower right’
- 5:‘right’
- 6:‘center left’
- 7:‘center right’
- 8:‘lower center’
- 9:‘upper center’
- 10:‘center’
-
fontsize设置字体大小,例如fontsize=12
-
frameon设置是否保留图例边框, True or False
-
edgecolor设置边框颜色
-
facecolor设置图例背景颜色
-
title设置图例的标题, title_fontsize设置图例中标题的大小
-
ncol 设置图例的列数,默认是1
-
labelspacing设置图例的垂直间距,默认值0.5
-
columnspacing设置列之间的间距
-
bbox_to_anchor定位图例的位置,四元组(x,y,w,h) 二元组(x, y)
注意具体的数值要协同loc进行调试
# 单图例
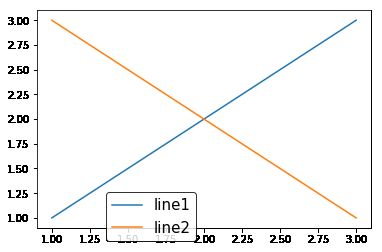
plt.figure()
plt.plot([1,2,3], [1,2,3])
plt.plot([1,2,3], [3,2,1])
plt.legend(['line1', 'line2'], labelspacing=0.5, fontsize=15, loc=0, bbox_to_anchor=[0.5, 0.2], frameon=True, edgecolor='black', facecolor='white')
plt.show()
# 多图例
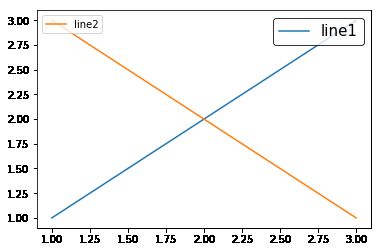
plt.figure()
p1 = plt.plot([1,2,3], [1,2,3])
p2 = plt.plot([1,2,3], [3,2,1])
l1 = plt.legend(p1, ['line1'], fontsize=15, loc=1, frameon=True, edgecolor='black', facecolor='white')
#下一句一定要有,不然只能显示一个图例
plt.gca().add_artist(l1)
plt.legend(p2, ['line2'], loc=2)
plt.show()
设置坐标轴
-
plt.xlabel
- s, fontsize设置字体大小,
- verticalalignment (‘top’, ‘bottom’, ‘center’, ‘baseline’)
- ‘center’, ‘right’, ‘left’)
-
plt.ylabel
- s, fontsize设置字体大小
- verticalalignment (‘top’, ‘bottom’, ‘center’, ‘baseline’)
- ‘center’, ‘right’, ‘left’)
- rotation设置书写方向,horizontal, vertital. 也可以使用数字, 注意配合上两项使用
-
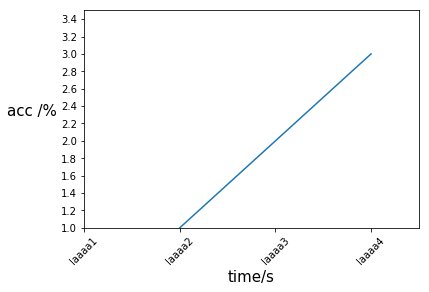
plt.xlim plt.ylim 设置坐标值的界限
plt.xlim(xmin, xmax)
plt.ylim(ymin, ymax) -
plt.xticks plt.yticks 设置坐标轴的刻度排列 【名称】 倾斜角度
plt.xticks(range(4), name[1: 5], rotation=45)
plt.xticks(np.arange(0, 4, 0.5), rotation=0) 看这个和xlim谁在前当使用plt.xticks([])表示x不显示刻度
plt.figure()
plt.plot([1,2,3], [1,2,3])
plt.xlabel('time/s', fontsize=15)
plt.ylabel('acc /%', fontsize=15, verticalalignment='bottom', horizontalalignment='right', rotation='horizontal')

plt.xticks(range(4), ['laaaa1', 'laaaa2', 'laaaa3', 'laaaa4'], rotation=45 )
plt.yticks(np.arange(0, 4, 0.2))

plt.xlim(0, 3.5)
plt.ylim(1, 3.5)

plt.show()
图的背景线
-
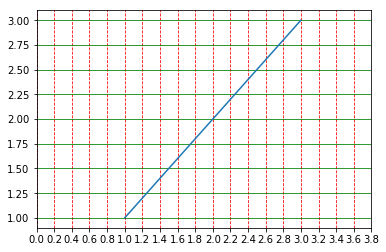
plt.grid设置横/竖格线
- axis选择方向 x, y, both 格线与刻度间隔设置相关
- color 同plot设置
- linestyle 同plot设置
- linewidth同plot设置
-
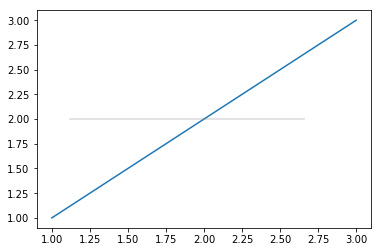
plt.axhline plt.axvline 在某个坐标轴位置绘制线条 或者ax.axhline
- y设置线的位置
- xmin设置线的起始点 0-1 0是起点 ,1是终点
- xmax设置线的终点 0-1
- color颜色
- alpha 透明度
- linewidth 线的宽度
plt.figure()
plt.plot([1,2,3], [1,2,3])
plt.grid(axis='x', color='r', linestyle='--')
plt.xticks(np.arange(0, 4, 0.2))
plt.grid(axis='y', color='g', linestyle='-')
plt.show()
plt.figure()
plt.plot([1,2,3], [1,2,3])
plt.axhline(2, xmin=0.1, xmax=0.8, c='gray', alpha=0.3)
plt.show()
绘制子图
-
plt.subplots直接创建画布以及坐标
- fig, ax = plt.subplots()
- fig, (ax1, ax2) = plt.subplots(2,2)
-
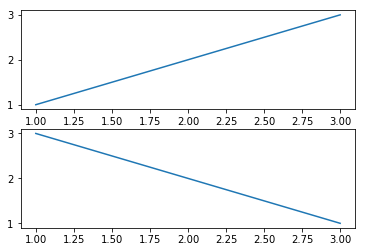
首先创建画布,fig = plt.figure(), 然后添加子图 ax1 = fig.add_subplot(2, 1, 1)
括号中的内容可以是用逗号隔开,方便回归做多个子图,也可以直接三个数写在一起,当然任意一个数不能超过9
- 说明,不涉及子图时,平时简单的plt.plot时会隐式创建画布
有了ax之后,之前的xlim,xlabel等都可以通过ax.set(xlim=[], xlabel=’’)等价形式来写
fig = plt.figure()
ax1 = fig.add_subplot(2, 1, 1)
plt.plot([1,2,3], [1,2,3])
ax2 = fig.add_subplot(212)
plt.plot([1,2,3], [3,2,1])
plt.show()
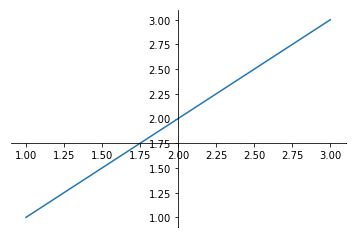
坐标线的颜色及位置
设置坐标线的颜色针对的是坐标,而不是画布,对这里的调整,主要是坐标的spines属性,通过设置颜色或者位置
-
spines包括四个位置top bottom left right
-
控制边界是否可见可以设置 ax.spines[‘top’].set_visible(False) 或者ax.spines[‘top’].set_color(‘none’)
-
控制其位置使用set_position
有三种设置
‘outward’ : 将spines从数据区域中放置指定数量的点。(负值指定将spines向内放置)
‘axes’ : 将spines放置在指定的Axes坐标处(从0.0-1.0开始),可以认为是按坐标长度百分比移动
‘data’ : 将spines放置在指定的数据坐标处
fig, ax = plt.subplots()
plt.plot([1,2,3], [1,2,3])
ax.spines['top'].set_visible(False)
ax.spines['right'].set_color('none')
ax.spines['left'].set_position(('axes', 0.5))
ax.spines['bottom'].set_position(('data', 1.75))
plt.show()
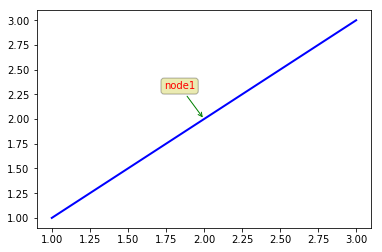
设置标注
-
s 为注释文本内容
-
xy 为被注释的坐标点
-
xytext 为注释文字的坐标位置
-
textcoords: text坐标系,此时注视文字位置不再是图片坐标系下 ‘offset points’‘offset pixels’
-
color 设置字体颜色
-
arrowprops #箭头参数,参数类型为字典dict
- width:箭头的宽度(以点为单位)
- headwidth:箭头底部以点为单位的宽度
- headlength:箭头的长度(以点为单位)
- shrink:总长度的一部分,从两端“收缩”
- facecolor:箭头颜色
- rrowstyle:箭头类型
============ =============================================
Name Attrs
============ =============================================
'-'None
'->'head_length=0.4,head_width=0.2
'-['widthB=1.0,lengthB=0.2,angleB=None
'|-|'widthA=1.0,widthB=1.0
'-|>'head_length=0.4,head_width=0.2
'<-'head_length=0.4,head_width=0.2
'<->'head_length=0.4,head_width=0.2
'<|-'head_length=0.4,head_width=0.2
'<|-|>'head_length=0.4,head_width=0.2
'fancy'head_length=0.4,head_width=0.4,tail_width=0.4
'simple'head_length=0.5,head_width=0.5,tail_width=0.2
'wedge'tail_width=0.3,shrink_factor=0.5
============ =============================================
-
bbox给标注增加外框 ,常用参数如下:
- boxstyle:方框外形
- facecolor:(简写fc)背景颜色
- dgecolor:(简写ec)边框线条颜色
- edgewidth:边框线条大小
- alpha:设置透明度
plt.figure()
plt.plot([1,2,3], [1,2,3], 'b-', linewidth=2)
plt.annotate('node1', xy=[2, 2], xytext=[-40, 30], textcoords='offset pixels',
             color='r',
             arrowprops={'arrowstyle':'->', 'color':'g'},
             bbox={'boxstyle':'round', 'facecolor':'y', 'alpha':0.3})
plt.show()
控制子图的间距
-
fig.subplots_adjust
参数包括top, bottom, left, right, wspace, hspace
left = 0.125 # the left side of the subplots of the figure
right = 0.9 # the right side of the subplots of the figure
bottom = 0.1 # the bottom of the subplots of the figure
top = 0.9 # the top of the subplots of the figure
当下面二者取0时,子图之间没有间距
wspace = 0.2 # the amount of width reserved for space between subplots,
# expressed as a fraction of the average axis width
hspace = 0.2 # the amount of height reserved for space between subplots,
# expressed as a fraction of the average axis height -
当使用上述方法比较麻烦时,可以使用fig.tight_layout()进行自动布局,满足不重叠
fig, axes = plt.subplots(2, 2, figsize=(4, 4))
fig.subplots_adjust(wspace=0, hspace=0.2, left=0.1, right=0.4, top=0.9, bottom=0.1)
# fig.tight_layout()
plt.show()
绘制其他图形
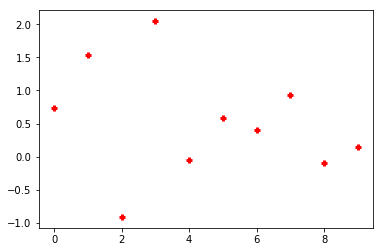
- 散点图
plt.scatter- x, y存储xy坐标序列
- color 颜色
- alpha 0-1设置透明度
- marker 点表示形式
============================== ===============================================
marker description
============================== ===============================================
"."point
","pixel
"o"circle
"v"triangle_down
"^"triangle_up
"<"triangle_left
">"triangle_right
"1"tri_down
"2"tri_up
"3"tri_left
"4"tri_right
"8"octagon
"s"square
"p"pentagon
"P"plus (filled)
"*"star
"h"hexagon1
"H"hexagon2
"+"plus
"x"x
"X"x (filled)
"D"diamond
"d"thin_diamond
"|"vline
"_"hline
============================== ===============================================
plt.scatter(np.arange(10), np.random.randn(10), color='red', marker='+', linewidth=3)
plt.show()
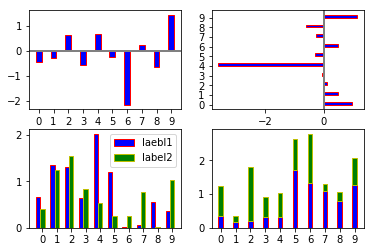
绘制条形图
plt.bar
-
width线条宽度 0-1。默认0.8
-
bottom设置线条基线,默认0
-
align 设置坐标与条形图的关系 ‘edge’ ‘center’
-
color 设置颜色
-
edgecolor 设置条形边缘颜色
-
tick_label 设置刻度名称,可以是单个数/字符串 或者对应x的列表
-
绘制横向的条形图
plt.barh- hight 同width 0-1
-
绘制多个并列的条形图
注意将横坐标按上一个实例的排列加上条形的宽即可
-
绘制多个堆叠的条形图
一种形式为表现相对关系,此时注意将小的最后显示即可
另一种是两个实例的绝对值显示出来,这里用到了bottom属性
fig, axs = plt.subplots(2, 2)
axs[0, 0].bar(np.arange(10), np.random.randn(10), color='blue', width=0.4, edgecolor='r', tick_label=np.arange(10), align='center')
axs[0, 0].axhline(0, color='gray', linewidth=2)

axs[0, 1].barh(np.arange(10), np.random.randn(10), color='blue', height=0.3, edgecolor='r', tick_label=np.arange(10), align='edge')
axs[0, 1].axvline(0, color='gray', linewidth=2)


axs[1, 0].bar(np.arange(10), np.abs(np.random.randn(10)), color='blue', width=0.3, edgecolor='r', tick_label=np.arange(10))
axs[1, 0].bar(np.arange(10)+np.ones(10)*0.3, np.abs(np.random.randn(10)), color='green', width=0.3, edgecolor='y', tick_label=np.arange(10))
axs[1, 0].legend(['laebl1', 'label2'])


a = np.abs(np.random.randn(10))
axs[1, 1].bar(np.arange(10), a, color='blue', width=0.3, edgecolor='r', tick_label=np.arange(10))
axs[1, 1].bar(np.arange(10), np.abs(np.random.randn(10)), bottom=a, color='green', width=0.3, edgecolor='y', tick_label=np.arange(10))

plt.show()
绘制箱形图
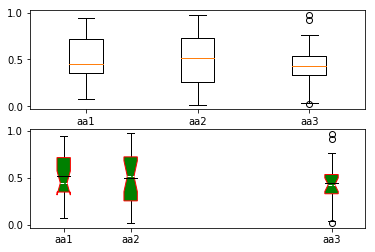
箱线图是一种基于五位数摘要(“最小”,第一四分位数(Q1),中位数,第三四分位数(Q3)和“最大”)显示数据分布的标准化方法。
-
中位数(Q2 / 50th百分位数):数据集的中间值;
-
第一个四分位数(Q1 / 25百分位数):最小数(不是“最小值”)和数据集的中位数之间的中间数;
-
第三四分位数(Q3 / 75th Percentile):数据集的中位数和最大值之间的中间值(不是“最大值”);
-
四分位间距(IQR):第25至第75个百分点的距离;
-
晶须
-
离群值/异常值
-
“最大”:Q3 + 1.5 * IQR
-
“最低”:Q1 -1.5 * IQR
================ ===============================================
参数 说明
================ ===============================================
x指定要绘制箱线图的数据;
vert是否需要将箱线图垂直摆放
patch_artist是否填充箱体的颜色;
boxprops设置箱体的属性,如边框色,填充色等;boxprops:color箱体边框色,facecolor箱体填充色;
showmeans是否显示均值
meanline是否用线的形式表示均值
labels为箱线图添加标签
widths指定箱线图的宽度
positions指定箱线图的位置
flierprops设置异常值的属性
notch是否是凹口的形式展现箱线图
showcaps是否显示箱线图顶端和末端的两条线
showbox是否显示箱线图的箱体
sym指定异常点的形状
showfliers是否显示异常值
whis指定上下须与上下四分位的距离
medianprops设置中位数的属性
meanprops设置均值的属性
capprops设置箱线图顶端和末端线条的属性
whiskerprops设置须的属性
============================== ================================
data = [np.abs(np.random.random(20)), np.abs(np.random.random(20)), np.abs(np.random.random(20))]
fig, (ax1, ax2) = plt.subplots(2)
ax1.boxplot(data, labels=['aa1', 'aa2', 'aa3'])
ax2.boxplot(data, labels=['aa1', 'aa2', 'aa3'], showmeans=True, meanline=True,
           patch_artist=True, widths=0.2,
           boxprops={'color':'r', 'facecolor':'g'},
           positions=[1,2,5],
           medianprops={'color':'w', 'linestyle':'--'},
           meanprops={'color':'black', 'linestyle':'-'},
           notch=True)
plt.show()
终端使用
matplot的后端分为交互式如qt5agg\ipymlpl\tkagg\webagg 和非交互式如agg\svg\pdf等
使用matplotlib.use设置时一定要在调用pyplot之前,也就是刚调用matplotlib之后
使用非交互式,最后可以通过保存画布进行图片保存
import matplotlib
matplotlib.use('Agg')
import matplotlib.pyplot as plt

plt.figure()
plt.plot([1,2,3], [1,2,3])
plt.show()
plt.savefig('test.jpg')
其余经常遇到的
显示灰度图
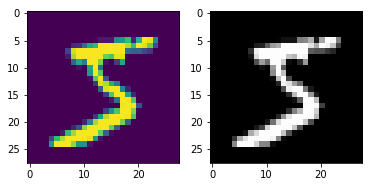
- plt.imshow显示灰度图时默认变成伪彩色
设置cmap属性为’gray’
import torchvision
import torch
mnist_train = torchvision.datasets.MNIST(root='/Users/lee/DataSets/', train=True, download=False, transform=torchvision.transforms.ToTensor())
img = np.array(mnist_train[0][0].squeeze())
fig, (ax1, ax2) = plt.subplots(1, 2)
ax1.imshow(img)
ax2.imshow(img, cmap='gray')
plt.show()
显示颜色条
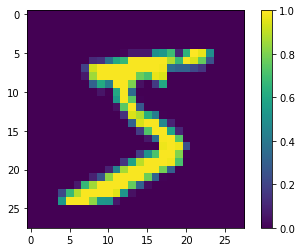
- plt.colorbar 绘制颜色条
plt.figure()
plt.imshow(img)
plt.colorbar()
plt.show()

