roc曲线简单介绍及实例代码
今日笔记:roc曲线
还是仅供自己参考学习。。
首先要注意的是roc曲线仅适用于二分类问题,不是二分类问题应首先通过各种手段转为二分类问题。
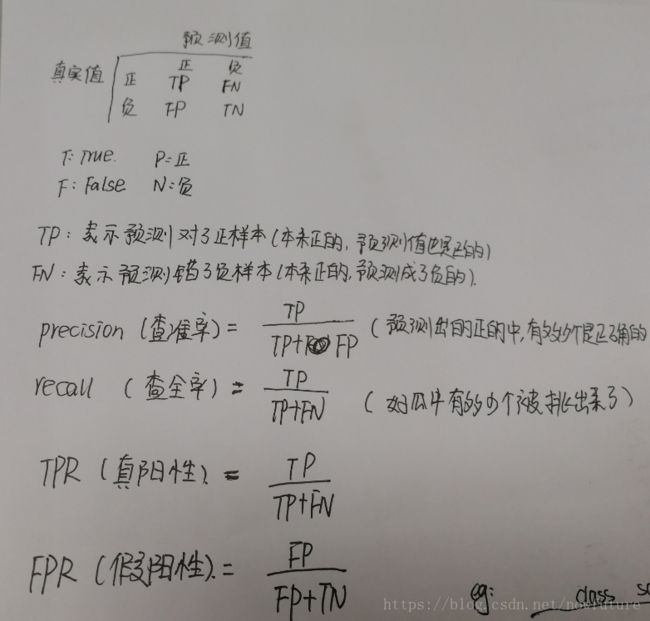
roc横坐标为TPR,纵坐标为TPR,若要知道TPR,FPR,就要从混淆矩阵说起...
漏掉了f1..f1 = 2*p*r / (p+r)
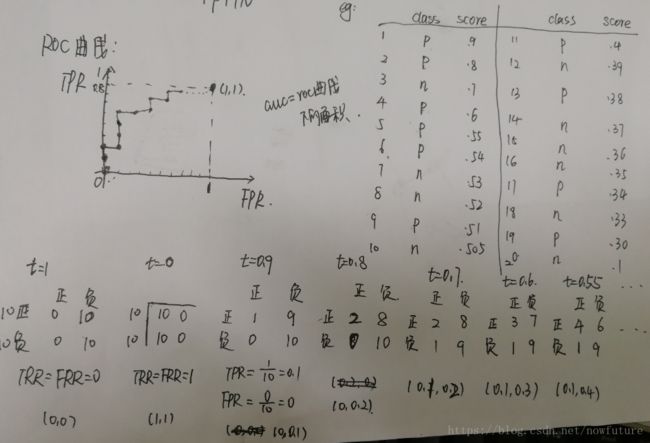
然后给定阈值,进行计算FPR,TPR
上代码,实现这个小例子:
from sklearn.metrics import roc_curve, auc
import numpy as np
##y_test相当于真实值,注意,roc曲线仅适用于二分类问题,多分类问题应先转化为二分类
y_test = np.array([1,1,0,1,1,1,0,0,1,0,1,0,1,0,0,0,1,0,1,0])
#y_score 根据x_test预测出的y_pre,根据出现的概率大小进行排列
y_score = np.array([0.9,0.8,0.7,0.6,0.55,0.54,0.53,0.52,0.51,0.505,0.4,0.39,0.38,0.37,0.36,0.35,0.34,0.33,0.3,0.1])
##
fpr,tpr,thre = roc_curve(y_test,y_score)
##计算auc的值,就是roc曲线下的面积
auc = auc(fpr,tpr)
##画图
plt.plot(fpr,tpr,color = 'darkred',label = 'roc area:(%0.2f)'%auc)
plt.plot([0,1],[0,1],linestyle = '--')
plt.xlim([0,1])
plt.ylim([0,1])
plt.xlabel('fpr')
plt.ylabel('tpr')
plt.title('roc_curve')
plt.legend(loc = 'lower right')
画出之后的结果如下:
下面根据鸢尾花数据进行画图,注意:鸢尾花是三分类问题,因此进行了改造,使其成为二分类问题。
上代码;
from sklearn.preprocessing import LabelEncoder
import numpy as np
import matplotlib.pyplot as plt
from itertools import cycle
import pandas as pd
from sklearn import svm, datasets
from sklearn.metrics import roc_curve, auc
from sklearn.model_selection import train_test_split

data = pd.read_csv('iris.csv',header = None)
##将第四列的无序非数值型数据转为数值型数据
y = data[[4]]
class_le = LabelEncoder()
y = class_le.fit_transform(y.values.ravel())

##对数据进行改造,成为二分类问题
X= data[[0,1,2,3]][y != 2]
y = y[y!=2]

# Add noisy features to make the problem harder
random_state = np.random.RandomState(0)
n_samples, n_features = X.shape
X = np.c_[X, random_state.randn(n_samples, 200 * n_features)]

# shuffle and split training and test sets
X_train, X_test, y_train, y_test = train_test_split(X, y, test_size=.5,random_state=0)

## Learn to predict each class against the other
classifier = svm.SVC(kernel='linear', probability=True,random_state=random_state)

##由decision_function函数得到y_score
y_score = classifier.fit(X_train,y_train).decision_function(X_test)

fpr,tpr,thre = roc_curve( y_test,y_score )
#
roc_auc = auc(fpr,tpr)
#
plt.figure()
lw = 2
plt.figure(figsize = (9,8))
plt.plot(fpr,tpr,color = 'darkorange',lw = lw,
         label = 'ROC curve (area = %0.2f)' %roc_auc)
plt.plot( [0,1],[0,1],color = 'navy' ,lw = lw,
         linestyle = '--')
plt.xlim([0.0, 1.0])
plt.ylim([0.0, 1.05])
plt.xlabel('False Positive Rate')
plt.ylabel('True Positive Rate')
plt.title('Receiver operating characteristic example')
plt.legend(loc="lower right")
plt.show()
实现结果如下:


