车位状态检测
一、分割图像得到样本(这一步至关重要)
学习:https://deeplearninganalytics.org/blog/page/4
给定若干副图像,如何得到样本点?----传统图像的经验
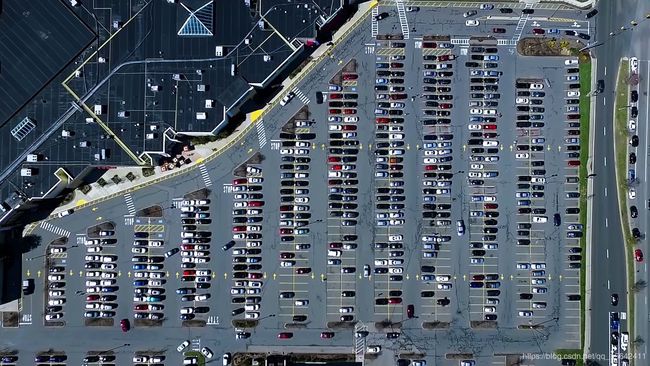
如下一副图像


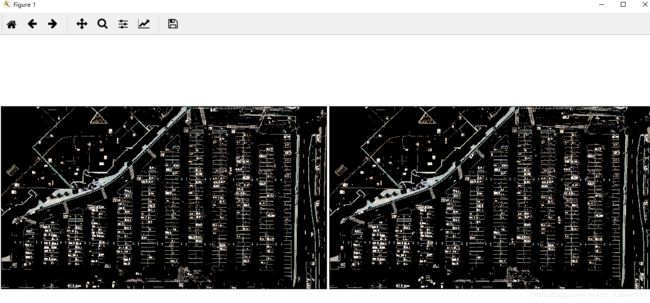
1)颜色提取,得到白色黄色的RGB图像
效果如下:

2)灰度化(技巧利用map函数,map(func,iter))
3)利用canny边缘检测
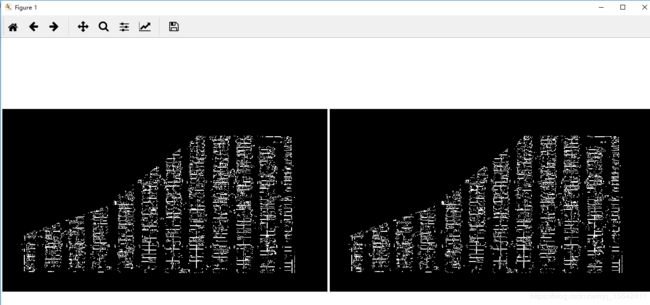
4)提取感兴趣区域
效果图如下:

5)霍夫直线检测(给予边缘检测后的图像)
6)得到每个车位的块(一列)
(1)对霍夫直线过滤
(2)对起点坐标(根据起点x1)排序
(3)聚类找到距离起点(x1)最近的点
(4)得到每个parking rect的坐标,建立缓冲得到每个车位块
效果图如下
7)得到每个车位
如下图:
8)裁剪图得到训练样本
二、利用CNN训练模型(keras就可以)
第一部分代码如下
#coding= utf-8
from __future__ import division
import matplotlib.pyplot as plt
import cv2
import os, glob
import numpy as np
cwd = os.getcwd()
def show_images(images, cmap=None):
    cols = 2
    rows = (len(images)+1)//cols
    plt.figure(figsize=(15, 12))
    for i, image in enumerate(images):
        plt.subplot(rows, cols, i+1)
        # 只有一个通道的时候用gray
        cmap = 'gray' if len(image.shape)==2 else cmap
        plt.imshow(image, cmap=cmap)
        plt.xticks([])
        plt.yticks([])
    plt.tight_layout(pad=0, h_pad=0, w_pad=0)
    plt.show()
test_images = [cv2.imread(os.path.abspath(cwd+"\\"+path)) for path in glob.glob('test_images/*.jpg')]
# show_images(test_images)
def select_rgb_white_yellow(image):
    # 白色提取,mask
    lower = np.uint8([120, 120, 120])
    upper = np.uint8([255, 255, 255])
    white_mask = cv2.inRange(image, lower, upper)
    # 黄色提取mask
    lower = np.uint8([190, 190,   0])
    upper = np.uint8([255, 255, 255])
    yellow_mask = cv2.inRange(image, lower, upper)
    # 联合mask
    mask = cv2.bitwise_or(white_mask, yellow_mask)
    masked = cv2.bitwise_and(image, image, mask = mask)
    return masked
white_yellow_images = list(map(select_rgb_white_yellow, test_images))
show_images(white_yellow_images)
#图像转换
def convert_gray_scale(image):
    return cv2.cvtColor(image, cv2.COLOR_RGB2GRAY)
gray_images = list(map(convert_gray_scale, white_yellow_images))
show_images(gray_images)
#使用canny 检测边缘
def detect_edges(image, low_threshold=50, high_threshold=200):
    return cv2.Canny(image, low_threshold, high_threshold)
edge_images = list(map(lambda image: detect_edges(image), gray_images))
show_images(edge_images)
#识别感兴趣区域
def filter_region(image, vertices):
    """
        利用输入图像的顶点创建一个mask
    """
    mask = np.zeros_like(image)
    if len(mask.shape)==2:
        cv2.fillPoly(mask, vertices, 255)#单通道,255是颜色
    else:
        cv2.fillPoly(mask, vertices, (255,)*mask.shape[2]) # 以免图像是多通道。
    return cv2.bitwise_and(image, mask)


def select_region(image):
    """

    """
    # 定义顶点
    rows, cols = image.shape[:2]
    pt_1  = [cols*0.05, rows*0.90]
    pt_2 = [cols*0.05, rows*0.70]
    pt_3 = [cols*0.30, rows*0.55]
    pt_4 = [cols*0.6, rows*0.15]
    pt_5 = [cols*0.90, rows*0.15]
    pt_6 = [cols*0.90, rows*0.90]
    # 顶点坐标虚整形,因为像素。
    vertices = np.array([[pt_1, pt_2, pt_3, pt_4, pt_5, pt_6]], dtype=np.int32)
    return filter_region(image, vertices)
roi_images = list(map(select_region, edge_images))
show_images(roi_images)
'''
'''
def hough_lines(image):
    """
    图像应该是边缘检测后的
    """
    return cv2.HoughLinesP(image, rho=0.1, theta=np.pi/10, threshold=15, minLineLength=9, maxLineGap=4)

list_of_lines = list(map(hough_lines, roi_images))

#画线
def draw_lines(image, lines, color=[255, 0, 0], thickness=2, make_copy=True):
    # cv2.HoughLinesP 变换检测出来的线形状如下: (-1, 1, 4)
    if make_copy:
        image = np.copy(image) # don't want to modify the original
    cleaned = []
    for line in lines:
        for x1,y1,x2,y2 in line:
            if abs(y2-y1) <=1 and abs(x2-x1) >=25 and abs(x2-x1) <= 55:#delta y<1说明是水平线,线的长度大于25,小于55
                cleaned.append((x1,y1,x2,y2))
                cv2.line(image, (x1, y1), (x2, y2), color, thickness)
    print(" 检测到的线的数目: ", len(cleaned))
    return image
line_images = []
for image, lines in zip(test_images, list_of_lines):#这里用的是原图,testimages,list_of_line是利用roiimage检测出来的
    line_images.append(draw_lines(image, lines))
show_images(line_images)
############

############

def identify_blocks(image, lines, make_copy=True):
    if make_copy:
        new_image = np.copy(image)
    #Step 1: 收集纯线,即是满足要求的线
    cleaned = []
    for line in lines:
        for x1,y1,x2,y2 in line:
            #水平线,长度鉴于25,55之间
            if abs(y2-y1) <=1 and abs(x2-x1) >=25 and abs(x2-x1) <= 55:
                cleaned.append((x1,y1,x2,y2))

    #Step 2: 对起点坐标排序,x1
    '''
    operator.itemgetter是获取哪一维数据
    '''
    import operator
    list1 = sorted(cleaned, key=operator.itemgetter(0, 1))
    #Step 3: 找到距离x1最近的点
    clusters = {}
    dIndex = 0
    clus_dist = 10

    for i in range(len(list1) - 1):
        distance = abs(list1[i+1][0] - list1[i][0])
    #         print(distance)
        if distance <= clus_dist:
            if not dIndex in clusters.keys(): clusters[dIndex] = []
            clusters[dIndex].append(list1[i])
            clusters[dIndex].append(list1[i + 1])

        else:
            dIndex += 1

    #Step 4:
    rects = {}
    i = 0
    for key in clusters:
        all_list = clusters[key]
        cleaned = list(set(all_list))
        if len(cleaned) > 5:
            cleaned = sorted(cleaned, key=lambda tup: tup[1])
            avg_y1 = cleaned[0][1]
            avg_y2 = cleaned[-1][1]
#             print(avg_y1, avg_y2)
            avg_x1 = 0
            avg_x2 = 0
            for tup in cleaned:
                avg_x1 += tup[0]
                avg_x2 += tup[2]
            avg_x1 = avg_x1/len(cleaned)
            avg_x2 = avg_x2/len(cleaned)
            rects[i] = (avg_x1, avg_y1, avg_x2, avg_y2)
            i += 1
#     print(clusters)
    print("parking 数目: ", len(rects))
    #Step 5: 画图
    buff = 7#建立缓冲区
    for key in rects:
        tup_topLeft = (int(rects[key][0] - buff), int(rects[key][1]))
        tup_botRight = (int(rects[key][2] + buff), int(rects[key][3]))
#         cv2.rectangle(new_image,(int(rects[key][0]),int(rects[key][1])),(int(rects[key][2]),int(rects[key][3])),(0,0,255),3)
        cv2.rectangle(new_image, tup_topLeft,tup_botRight,(0,255,0),3)
    return new_image, rects
####
rect_images = []
rect_coords = []
for image, lines in zip(test_images, list_of_lines):
    new_image, rects = identify_blocks(image, lines)
    rect_images.append(new_image)
    rect_coords.append(rects)
show_images(rect_images)
#########
'''
识别每个停车场区域的每个车位
'''
#########
def draw_parking(image, rects, make_copy = True, color=[255, 0, 0], thickness=2, save = True):
    if make_copy:
        new_image = np.copy(image)
    gap = 15.5
    spot_dict = {} # 储存每个车位的id
    tot_spots = 0
    adj_y1 = {0: 20, 1:-10, 2:0, 3:-11, 4:28, 5:5, 6:-15, 7:-15, 8:-10, 9:-30, 10:9, 11:-32}
    adj_y2 = {0: 30, 1: 50, 2:15, 3:10, 4:-15, 5:15, 6:15, 7:-20, 8:15, 9:15, 10:0, 11:30}

    adj_x1 = {0: -8, 1:-15, 2:-15, 3:-15, 4:-15, 5:-15, 6:-15, 7:-15, 8:-10, 9:-10, 10:-10, 11:0}
    adj_x2 = {0: 0, 1: 15, 2:15, 3:15, 4:15, 5:15, 6:15, 7:15, 8:10, 9:10, 10:10, 11:0}
    for key in rects:
        # 水平线
        if key<12:
            tup = rects[key]
            x1 = int(tup[0]+ adj_x1[key])
            x2 = int(tup[2]+ adj_x2[key])
            y1 = int(tup[1] + adj_y1[key])
            y2 = int(tup[3] + adj_y2[key])
            cv2.rectangle(new_image, (x1, y1),(x2,y2),(0,255,0),2)
            num_splits = int(abs(y2-y1)//gap)
            for i in range(0, num_splits+1):
                y = int(y1 + i*gap)
                cv2.line(new_image, (x1, y), (x2, y), color, thickness)
            if key > 0 and key < len(rects) -1 :
            #画上竖直线
                x = int((x1 + x2)/2)
                cv2.line(new_image, (x, y1), (x, y2), color, thickness)
        #
            if key == 0 or key == (len(rects) -1):
                tot_spots += num_splits +1
            else:
                tot_spots += 2*(num_splits +1)

        #
            if key == 0 or key == (len(rects) -1):
                for i in range(0, num_splits+1):
                    cur_len = len(spot_dict)
                    y = int(y1 + i*gap)
                    spot_dict[(x1, y, x2, y+gap)] = cur_len +1
            else:
                for i in range(0, num_splits+1):
                    cur_len = len(spot_dict)
                    y = int(y1 + i*gap)
                    x = int((x1 + x2)/2)
                    spot_dict[(x1, y, x, y+gap)] = cur_len +1
                    spot_dict[(x, y, x2, y+gap)] = cur_len +2

    print("总的停车位: ", tot_spots, cur_len)
    if save:
        filename = 'with_parking.jpg'
        cv2.imwrite(filename, new_image)
    return new_image, spot_dict
#
delineated = []
spot_pos = []
for image, rects in zip(test_images, rect_coords):
    new_image, spot_dict = draw_parking(image, rects)
    delineated.append(new_image)
    spot_pos.append(spot_dict)
# print(spot_pos)
show_images(delineated)
#
final_spot_dict = spot_pos[1]
def assign_spots_map(image, spot_dict=final_spot_dict, make_copy = True, color=[255, 0, 0], thickness=2):
    if make_copy:
        new_image = np.copy(image)
    for spot in spot_dict.keys():
        (x1, y1, x2, y2) = spot
        cv2.rectangle(new_image, (int(x1),int(y1)), (int(x2),int(y2)), color, thickness)
    return new_image

marked_spot_images = list(map(assign_spots_map, test_images))
show_images(marked_spot_images)
#
import pickle

with open('spot_dict.pickle', 'wb') as handle:
    pickle.dump(final_spot_dict, handle, protocol=pickle.HIGHEST_PROTOCOL)
    ## 得到训练样本
def save_images_for_cnn(image, spot_dict = final_spot_dict, folder_name ='for_cnn'):
    for spot in spot_dict.keys():
        (x1, y1, x2, y2) = spot
        (x1, y1, x2, y2) = (int(x1), int(y1), int(x2), int(y2))
        #crop this image
#         print(image.shape)
        spot_img = image[y1:y2, x1:x2]
        spot_img = cv2.resize(spot_img, (0,0), fx=2.0, fy=2.0)
        spot_id = spot_dict[spot]

        filename = 'spot' + str(spot_id) +'.jpg'
        print(spot_img.shape, filename, (x1,x2,y1,y2))
#         print(os.path.join(cwd+"\\"+folder_name, filename))
        cv2.imwrite(os.path.join(cwd+"\\"+folder_name, filename), spot_img)
save_images_for_cnn(test_images[0])