机器学习性能度量(1):P-R曲线与ROC曲线,python sklearn实现
最近做实验要用到性能度量的东西,之前学习过现在重新学习并且实现一下。
衡量模型泛化能力的评价标准,这就是性能度量。性能度量反应了任务需求,在对比不同模型的能力时,使用不同的性能度量往往会导致不同的评判结果;什么样的模型是好的,不仅取决于算法和数据,还决定于任务需求。
一、性能度量方法
1.1错误率与精度
错误率是分类错误的样本数占样本总数的比例,精度是分类正确的样本数占样本总数的比例。
1.2查准率(precision)、查全率(recall)与F1
对于二分类问题,将样例根据其真实类别与预测类别的组合划分为真正例(true positive,TP)、假正例(false positive,FP)、真反例(true negative,TN)、假反例(false negative,FN)。有![]() (
(![]() 为样本总数)。分类结果的混肴矩阵:
为样本总数)。分类结果的混肴矩阵:
| 真实情况 | 预测结果 | |
| 正例 | 反例 | |
| 正例 | TP | FN |
| 反例 | FP | TN |
查准率![]() 与查全率
与查全率![]() 分别定义为
分别定义为
![]() ,
,
![]() .
.
算法对样本进行分类时,都会有置信度,即表示该样本是正样本的概率,比如99%的概率认为样本A是正例,1%的概率认为样本B是正例。通过选择合适的阈值,比如50%,对样本进行划分,概率大于50%的就认为是正例,小于50%的就是负例。
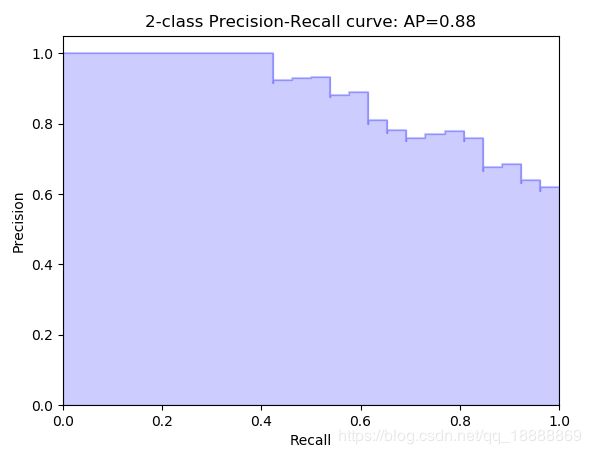
通过置信度就可以对所有样本进行排序,再逐个样本的选择阈值,在该样本之前的都属于正例,该样本之后的都属于负例。每一个样本作为划分阈值时,都可以计算对应的precision和recall,那么就可以以此绘制曲线。那很多书上、博客上给出的P-R曲线,都长这样
平衡点(break-even point,BEP)是查准率=查全率时的取值。基于它可以判断学习器的优劣。
但是BEP还是过于简化,更常用的是F1度量:
F1度量的一般形式![]() ,能让我们表达出对查准率/查全率的不同偏好,定义为
,能让我们表达出对查准率/查全率的不同偏好,定义为
其中![]() 度量了查全率对查准率的相对重要性。
度量了查全率对查准率的相对重要性。![]() 时退化为标准的F1;
时退化为标准的F1;![]() 时查全率有更大的影响;
时查全率有更大的影响;![]() 时查准率有更大的影响。
时查准率有更大的影响。
有时候我们有多个二分类混淆矩阵,例如进行多次训练测试;或是在多个数据集上训练测试等,我们希望在n个二分类混淆矩阵上总和考察查准率和查全率。因此有宏F1和微F1。
1.2ROC与AUC
ROC全称受试者工作特征(Receiver Operating Characteristic)曲线,ROC曲线的纵轴是真正例率(True Positive Rate,TPR),横轴是假正例率(False Positive Rate,FPR),定义:
AUC(Area Under ROC Curve) :为ROC曲线下的面积和,通过它来判断学习器的性能。AUC考虑的是样本预测的排序质量。
给定![]() 个正例和
个正例和![]() 个反例,令
个反例,令![]() 和
和![]() 分别表示正反例集合,定义排序损失
分别表示正反例集合,定义排序损失![]() :
:
即考虑一对正反例,若正例预测值小于反例,记一个罚分,若相等,记0.5个罚分。容易看出![]() 对应的是ROC曲线之上的面积。因此有
对应的是ROC曲线之上的面积。因此有
![]()
二、python实现
图均为上节中引用的图片,在此不重复引用。
2.1P-R
from sklearn import svm, datasets
from sklearn.model_selection import train_test_split
import numpy as np

iris = datasets.load_iris()
X = iris.data
y = iris.target

# Add noisy features
random_state = np.random.RandomState(0)
n_samples, n_features = X.shape
X = np.c_[X, random_state.randn(n_samples, 200 * n_features)]

# Limit to the two first classes, and split into training and test
X_train, X_test, y_train, y_test = train_test_split(X[y < 2], y[y < 2],
                                                    test_size=.5,
                                                    random_state=random_state)

# Create a simple classifier
classifier = svm.LinearSVC(random_state=random_state)
classifier.fit(X_train, y_train)
y_score = classifier.decision_function(X_test)


from sklearn.metrics import precision_recall_curve
import matplotlib.pyplot as plt

precision, recall, _ = precision_recall_curve(y_test, y_score)

plt.step(recall, precision, color='b', alpha=0.2,
         where='post')
plt.fill_between(recall, precision, step='post', alpha=0.2,
                 color='b')

plt.xlabel('Recall')
plt.ylabel('Precision')
plt.ylim([0.0, 1.05])
plt.xlim([0.0, 1.0])
plt.title('2-class Precision-Recall curve: AP={0:0.2f}'.format(
          average_precision))
2.2ROC
import numpy as np
import matplotlib.pyplot as plt
from itertools import cycle

from sklearn import svm, datasets
from sklearn.metrics import roc_curve, auc
from sklearn.model_selection import train_test_split
from sklearn.preprocessing import label_binarize
from sklearn.multiclass import OneVsRestClassifier
from scipy import interp

# Import some data to play with
iris = datasets.load_iris()
X = iris.data
y = iris.target

# Binarize the output
y = label_binarize(y, classes=[0, 1, 2])
n_classes = y.shape[1]

# Add noisy features to make the problem harder
random_state = np.random.RandomState(0)
n_samples, n_features = X.shape
X = np.c_[X, random_state.randn(n_samples, 200 * n_features)]

# shuffle and split training and test sets
X_train, X_test, y_train, y_test = train_test_split(X, y, test_size=.5,
                                                    random_state=0)

# Learn to predict each class against the other
classifier = OneVsRestClassifier(svm.SVC(kernel='linear', probability=True,
                                 random_state=random_state))
y_score = classifier.fit(X_train, y_train).decision_function(X_test)

# Compute ROC curve and ROC area for each class
fpr = dict()
tpr = dict()
roc_auc = dict()
for i in range(n_classes):
    fpr[i], tpr[i], _ = roc_curve(y_test[:, i], y_score[:, i])
    roc_auc[i] = auc(fpr[i], tpr[i])

# Compute micro-average ROC curve and ROC area
fpr["micro"], tpr["micro"], _ = roc_curve(y_test.ravel(), y_score.ravel())
roc_auc["micro"] = auc(fpr["micro"], tpr["micro"])

plt.figure()
lw = 2
plt.plot(fpr[2], tpr[2], color='darkorange',
         lw=lw, label='ROC curve (area = %0.2f)' % roc_auc[2])
plt.plot([0, 1], [0, 1], color='navy', lw=lw, linestyle='--')
plt.xlim([0.0, 1.0])
plt.ylim([0.0, 1.05])
plt.xlabel('False Positive Rate')
plt.ylabel('True Positive Rate')
plt.title('Receiver operating characteristic example')
plt.legend(loc="lower right")
plt.show()
机器学习性能度量(2):错误接受率 (FAR), 错误拒绝率(FRR),EER计算方法,python实现
https://blog.csdn.net/qq_18888869/article/details/84942224

