Unity自定义UI组件(十二) 条形图篇
前言
之前的编写的插件并没有注重基类的搭建,每一次的坐标代码、网格代码都需要在新的工具中重新一次,本篇的新工具条形图是基于SpringGUI基类建造,大幅度降低类似组件的开发速度,开发时间全部集中在个性打造,无需考虑基建(基础坐标,网格等基础设置)问题,详情往下阅读。
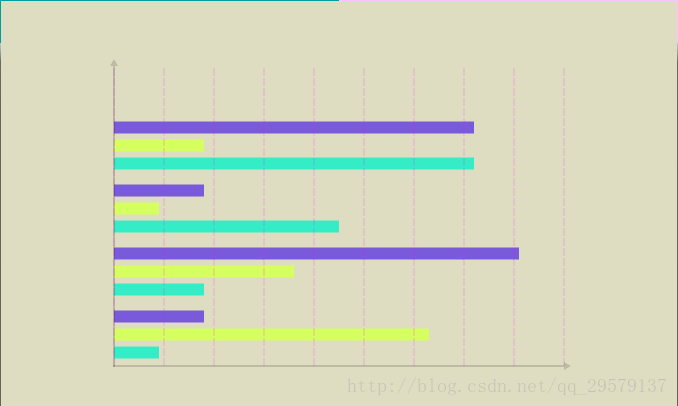
实现效果
- 单组条形图
- 多组条形图
- 水平方向
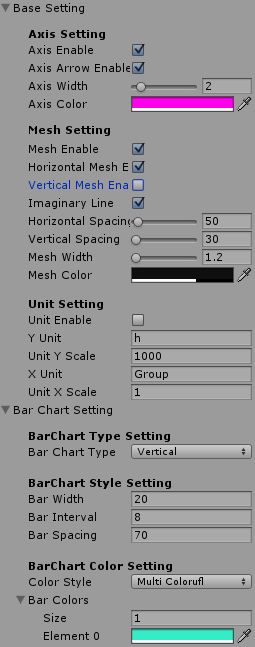
- Inspector
主要内容
- SpringGUI基类的搭建
- 条形图的实现
详细设计
基类搭建
GUI中需要可视化显示数据的组件中,多数都会有基础坐标轴、网格或者等位等基础功能,我们无需在每一个组件都编写这部分的代码,我们可以用一个所有的组件类去继承这个基类,基类负责完成所有的基础功能,这样子类就无需重写,可直接使用父类的实现,如果需要特殊定制可在子类中重写父类的方法实现差异化。接下来我们讲讲SpringGUI中目前基类的搭建情况。
绘制基类
绘制基类中提供的是方便绘制直线的方法,可以通过继承此类,直接使用该类中提供的方法,比如两点绘制直线,四个点绘制直线快速构造UIVertex等方法。
- 创建基类接口
namespace SpringGUI
{
    public interface ISpringGUIBase
    {
        // 两点绘制直线
        UIVertex[] GetQuad(Vector2 startPos, Vector2 endPos, Color color0, float LineWidth = 2.0f);
        // 零点绘制直线
        VertexHelper GetQuad(VertexHelper vh, Vector2 startPos, Vector2 endPos, Color color0, float LineWidth = 2.0f);

        // 两点绘制虚线
        VertexHelper GetQuadDottedline( VertexHelper vh , Vector2 startpos , Vector2 endPos , Color color0 , float lineWidth = 2.0f );

        // 获取UIVertex
        UIVertex GetUIVertex(Vector2 point, Color color0);
        // 获取UIVertex
        UIVertex GetUIVertex(Vector2 point, Color color0, Vector2 uv);
    }
}- 实现基类
namespace SpringGUI
{
    public class sgBase : ISpringGUIBase
    {
        //.. 具体实现
    }
}
图表绘制基类
绘制基类中提供的方法是在所有的组件中都用得到的方法,但是有部分方法是在特定的组件中才会使用得,没有必要全部都由一个基类来实现,所以我们新建一个图表绘制基类,让图表绘制基类继承至绘制基类,然后在图表绘制基类中还可以添加一些用于绘制图表组件的特定功能,比如绘制坐标轴、绘制网格等。具体编码:
- 图表绘制接口
namespace SpringGUI
{
public interface IDataGraphFactory
{
/// - 图表绘制基类的实现
// 继承绘制基类方便调用绘制基类提供的绘制方法,避免代码的冗余
namespace SpringGUI
{
    public class sgDataGraphBase: sgBase, IDataGraphFactory
    {
        // 具体实现
    }
}
图表绘制属性基类
为使组件的自定义范围更广,所以我们将更多属性显示在Inspector面板,方便进行可视化的调整,并实时查看效果,但是由于属性过多,每个组件都编写一次很麻烦,我们将常用属性也封装建立基类,然后在后续的开发中只需要引入一个字段,即可在Inspector面板进行基础属性的配置。目前只有一下属性可配置,后续应该会加入其它的新的可配置属性。
namespace SpringGUI
{
    [Serializable]
    public class sgSettingBase
    {
        // Axis
        [Header("Axis Setting")]
        public bool AxisEnable = false;
        public bool AxisArrowEnable = true;
        [Range(1.0f,10.0f)]
        public float AxisWidth = 2.0f;
        public Color AxisColor = Color.black;

        [Space(3)]
        // Background
        [Header("Mesh Setting")]
        public bool MeshEnable = true;
        public bool HorizontalMeshEnable = true;
        public bool VerticalMeshEnable = true;
        public bool ImaginaryLine = true;
        [Range(5.0f,1000f)]
        public float HorizontalSpacing = 50.0f;
        [Range(5.0f,1000f)]
        public float VerticalSpacing = 50.0f;
        [Range(1.0f,10.0f)]
        public float MeshWidth = 2.0f;
        public Color MeshColor = Color.black;

        [Space(3)]
        // Unit
        [Header("Unit Setting")]
        public bool UnitEnable = false;
        public string YUnit = "KWh";
        public float UnitYScale = 1000;
        public string XUnit = "";
        public float UnitXScale = 200;
    }
}
条形图实现
准备工作,继承基类,配置Inspector
得益于我们已经建立好的基类,在实现条形图时:1.条形图绘制类继承图表绘制基类;2.条形图组件声明一个图表属性基类的字段;3.在继承了MaskableGraphic的图形图组件类BarChart中调用条图形绘制类BarChartFactory.DrawBarChart方法;简单的操作之后再Scene视图中即可得到已经绘制好的坐标轴和网格,并且可在BarChart组件Inspector面板中设置对应的基础属性。
个性化过程,绘制条形图
网格的绘制不在讲解,详细绘制原理请查看以往的其他组件,目前条形图类型大概分为以下几种风格,可垂直,可水平,可单色,也可配置为多种色彩,实现原理也都比较简单,大致如下:
- 垂直/水平化
在调用客户端调用绘制接口时,会自动根据配置的水平和垂直类型进行调用的区分。
,具体的绘制计算法就不写了,不懂绘制原理的同学可以自行去之前文章里进行查看点击使用飞机票。
public override VertexHelper DrawMesh(VertexHelper vh, Rect rect )
{
    if (null == Data || null == Setting)
        return vh;
    switch (Setting.BarChartType)
    {
        case BarChartType.Vertical:
            DrawVertical(vh);
            break;
        case BarChartType.Horizontal:
            DrawHorizontal(vh);
            break;
    }
    return base.DrawMesh(vh, rect);
}

private void DrawVertical( VertexHelper vh )
{
    //.. 具体绘制
}

private void DrawHorizontal( VertexHelper vh )
{
    //.. 具体绘制
}
- 单色/彩色化
单色/彩色从面板配置之后
,绘制时会调用该方法获取颜色,从而使得可颜色/彩色化。并提供单条彩色、多条彩色、单条纯色和多条纯色的设置,具体的效果大家看下面的代码就明白了。
private Color BarColor( int index = 0 )
{
    Color result = Color.white;
    if (Setting.BarColors.Length.Equals(0))
    {
        Debug.LogWarning("Please set bar color properties on BarChart component's inspector panel.");
        return result;
    }
    switch (Setting.ColorStyle)
    {
        case ColorStyle.SingleNormal:
            result = Setting.BarColors[0];
            break;
        case ColorStyle.SingleColorful:
            if (index >= Setting.BarColors.Length)
            {
                Debug.LogError("Please set bar color properties on BarChart component's inspector panel.");
                return result;
            }
            result = Setting.BarColors[index];
            break;
        case ColorStyle.MultiNormal:
            if (index >= Setting.BarColors.Length)
            {
                Debug.LogError("Please set bar color properties on BarChart component's inspector panel.");
                return result;
            }
            result = Setting.BarColors[0];
            break;
        case ColorStyle.MultiColorufl:
            result = Setting.BarColors[index];
            break;
    }
    return result;
}
后续拓展
1.今天参加了一个会议是大数据可视化的方向,才意识我的工具都不具备交互能力,后续我会陆续为所有的组件添加尽可能多的交互方式。
2.以上条形图组件开发只是一个出版,我们可以将它的功能开发的更加齐全,比如计算平均线,折线走势,仿3D等,若有人有响应的需求的话,我将陆续升级,因为还有更多的组件我想去开发完善,初版完成之后,再讲所有的组件构建一次,这是目前的大致方向。
UGUI组件系列
- Unity自定义UI组件(十一) 雷达图、属性图
- Unity自定义UI组件(十) 折线图
- Unity自定义UI组件(九) 颜色拾取器(下)
- Unity自定义UI组件(八) 颜色拾取器(上)
- Unity自定义UI组件(七)渐变工具、渐变色图片、渐变遮罩
- Unity自定义UI组件(六)日历、日期拾取器
- Unity自定义组件之(五) 目录树 UITree
- Unity自定义UI组件(四)双击按钮、长按按钮
- Unity自定义UI组件(三)饼图篇
- Unity自定义UI组件(二)函数图篇(下)
- Unity自定义UI组件(一)函数图篇(上)
Unity框架解读系列
- [Unity]PureMVC框架解读(下)
- [Unity]PureMVC框架解读(上)
分享地址(置顶目录包含所有组件的最新下载地址)
- Github :https://github.com/ll4080333/UnityCodes
- CSDN : http://blog.csdn.net/qq_29579137
- 博客专栏 : http://blog.csdn.net/column/details/16329.html
- QQ群 : 593906968 有什么不懂的可以加群咨询互相学习
如果你想了解UGUI的更多拓展组件,欢迎关注我的博客,我会持续更新,支持一下我这个博客新手,你的关注也会给予我更多的动力。如果以上文章对你有帮助,点个赞,让更多的人看到这篇文章,我们一起学习。如果有什么指点的地方欢迎在评论区留言,秒回复。


