scikit-learn Cookbook-3
第四章 使用 scikit-learn 对数据分类
本章包括以下主题:
- [使用决策树实现基本的分类]
- [调整决策树模型]
- [使用许多决策树 – 随机森林]
- [调整随机森林模型]
- [使用支持向量机对数据分类]
- [使用多类分类来归纳]
- [将 LDA 用于分类]
- [使用 QDA - 非线性 LDA]
- [使用随机梯度下降来分类]
- [使用朴素贝叶斯来分类数据]
- [标签传递,半监督学习]
4.1 使用决策树实现基本的分类
# 首先,让我们获取一些分类数据,我们可以使用它来练习:

from sklearn import datasets
X, y = datasets.make_classification(n_samples=1000, n_features=3,
n_redundant=0)

preds = dt.predict(X)
(y == preds).mean()
首先,如果你观察dt对象,它拥有多种关键字参数,决定了对象的行为。我们如何选择对象十分重要,所以我们要详细观察对象的效果。我们要观察的第一个细节是max_depth。这是个重要的参数,决定了允许多少分支。这非常重要,因为决策树需要很长时间来生成样本外的数据,它们带有一些类型的正则化。之后,我们会看到,我们如何使用多种浅层决策树,来生成更好的模型。让我们创建更复杂的数据集并观察当我们允许不同max_depth时会发生什么。
n_features=200
X, y = datasets.make_classification(750, n_features,n_informative=5)

import numpy as np
training = np.random.choice([True, False], p=[.75, .25],size=len(y))

accuracies = []
for x in np.arange(1, n_features+1):
    dt = DecisionTreeClassifier(max_depth=x)
    dt.fit(X[training], y[training])
    preds = dt.predict(X[~training])
    accuracies.append((preds == y[~training]).mean())

import matplotlib.pyplot as plt
f, ax = plt.subplots(figsize=(7, 5))
ax.plot(range(1, n_features+1), accuracies, color='k')
ax.set_title("Decision Tree Accuracy")
ax.set_ylabel("% Correct")
ax.set_xlabel("Max Depth")
plt.show()
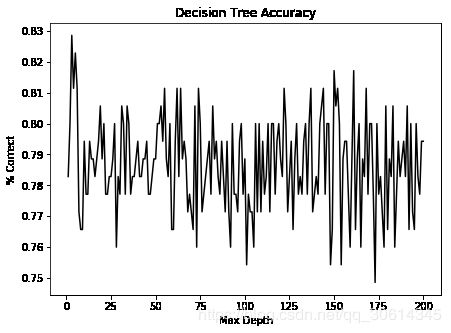
我们可以看到,我们实际上在较低最大深度处得到了漂亮的准确率。让我们进一步看看低级别的准确率,首先是 15:
N = 15
import matplotlib.pyplot as plt
f, ax = plt.subplots(figsize=(7, 5))
ax.plot(range(1, n_features+1)[:N], accuracies[:N], color='k')
ax.set_title("Decision Tree Accuracy")
ax.set_ylabel("% Correct")
ax.set_xlabel("Max Depth")
plt.show()
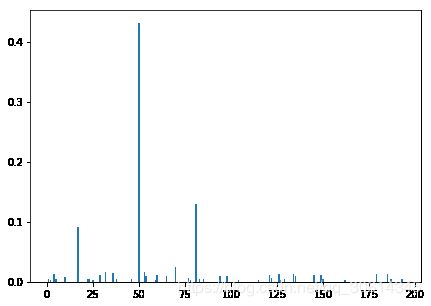
dt_ci = DecisionTreeClassifier()
dt.fit(X, y)
ne0 = dt.feature_importances_ != 0
y_comp = dt.feature_importances_[ne0]
x_comp = np.arange(len(dt.feature_importances_))[ne0]
import matplotlib.pyplot as plt
f, ax = plt.subplots(figsize=(7, 5))
ax.bar(x_comp, y_comp)
plt.show()
4.2 调整决策树模型
from sklearn import datasets
X, y = datasets.make_classification(1000, 20, n_informative=3)
from sklearn.tree import DecisionTreeClassifier
dt = DecisionTreeClassifier()
dt.fit(X, y)
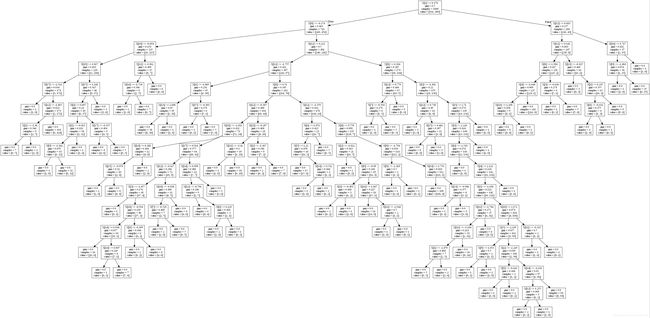
import io
str_buffer = io.StringIO()
from sklearn import tree
import pydotplus
tree.export_graphviz(dt, out_file=str_buffer)
graph = pydotplus.graph_from_dot_data(str_buffer.getvalue())
graph.write("tree1.jpg")
dt = DecisionTreeClassifier(max_depth=5).fit(X, y)
def plot_dt(model, filename):
    str_buffer = io.StringIO()
    tree.export_graphviz(model, out_file=str_buffer)
    graph = pydotplus.graph_from_dot_data(str_buffer.getvalue())
    graph.write_jpg(filename)
plot_dt(dt, "tree2.png")
# 如果我们将熵用作分割标准,会发生什么:

dt = DecisionTreeClassifier(criterion='entropy',max_depth=5).fit(X, y)
plot_dt(dt, "entropy.png")
dt = DecisionTreeClassifier(min_samples_leaf=10,
                                criterion='entropy',
                                max_depth=5).fit(X, y)
4.3 使用许多决策树 – 随机森林
随即森林通过构造大量浅层树,之后让每颗树为分类投票,再选取投票结果。这个想法在机器学习中十分有效。如果我们发现简单训练的分类器只有 60% 的准确率,我们可以训练大量分类器,它们通常是正确的,并且随后一起使用它们。
训练随机森林分类器的机制在 Scikit 中十分容易。这一节中,我们执行以下步骤:
- 创建用于练习的样例数据集
- 训练基本的随机森林对象
- 看一看训练对象的一些属性
from sklearn import datasets
X, y = datasets.make_classification(1000)

from sklearn.ensemble import RandomForestClassifier
rf = RandomForestClassifier()
rf.fit(X, y)

print( "Accuracy:\t", (y == rf.predict(X)).mean() )
# Accuracy:	 0.996

print("Total Correct:\t", (y == rf.predict(X)).sum())
# Total Correct:	 996
首先,我们查看一些实用属性。这里,由于我们保留默认值,它们是对象的默认值:
rf.criterion:这是决定分割的标准。默认是gini。rf.bootstrap:布尔值,表示在训练随机森林时是否使用启动样例rf.n_jobs:训练和预测的任务数量。如果你打算使用所有处理器,将其设置为-1。要记住,如果你的数据集不是非常大,使用过多任务通常会导致浪费,因为处理器之间需要序列化和移动。rf.max_features:这表示执行最优分割时,考虑的特征数量。在调参过程中这会非常方便。rf.conpute_importtances:这有助于我们决定,是否计算特征的重要性。如何使用它的信息,请见更多一节。rf.max_depth:这表示树的深度。
有许多属性需要注意,更多信息请查看官方文档。
probs = rf.predict_proba(X)
import pandas as pd
probs_df = pd.DataFrame(probs, columns=['0', '1'])
probs_df['was_correct'] = rf.predict(X) == y
import matplotlib.pyplot as plt
f, ax = plt.subplots(figsize=(7, 5))
probs_df.groupby('0').was_correct.mean().plot(kind='bar', ax=ax)
ax.set_title("Accuracy at 0 class probability")
ax.set_ylabel("% Correct")
ax.set_xlabel("% trees for 0")
plt.show()

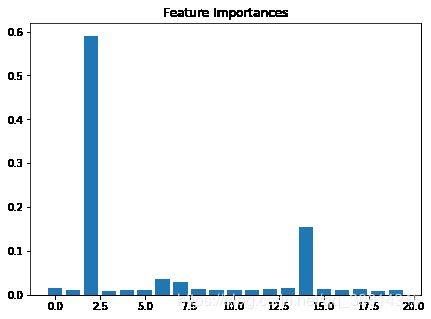
特征重要性是随机森林的不错的副产品。这通常有助于回答一个问题:如果我们拥有 10 个特征,对于判断数据点的真实类别,哪个特征是最重要的?真实世界中的应用都易于观察。例如,如果一个事务是不真实的,我们可能想要了解,是否有特定的信号,可以用于更快弄清楚事务的类别。
rf = RandomForestClassifier()
rf.fit(X, y)
f, ax = plt.subplots(figsize=(7, 5))
ax.bar(range(len(rf.feature_importances_)),rf.feature_importances_)
ax.set_title("Feature Importances")
plt.show()
4.4 调整随机森林模型
为了调整随机森林模型,我们首先需要创建数据集,它有一些难以预测。之后,我们修改参数并且做一些预处理来更好地拟合数据集。
from sklearn import datasets
X, y = datasets.make_classification(n_samples=10000,
                                    n_features=20,
                                    n_informative=15,
                                    flip_y=.5, weights=[.2, .8])
import numpy as np
training = np.random.choice([True, False], p=[.8, .2],size=y.shape)
from sklearn.ensemble import RandomForestClassifier
rf = RandomForestClassifier()
rf.fit(X[training], y[training])
preds = rf.predict(X[~training])
print("Accuracy:\t", (preds == y[~training]).mean())
让我们迭代max_features的推荐选项,并观察对拟合有什么影响。我们同事迭代一些浮点值,它们是所使用的特征的分数。使用下列命令:
from sklearn.metrics import confusion_matrix
max_feature_params = ['auto', 'sqrt', 'log2', .01, .5, .99]
confusion_matrixes = {}
for max_feature in max_feature_params:
    rf = RandomForestClassifier(max_features=max_feature)
    rf.fit(X[training], y[training])
    confusion_matrixes[max_feature] = confusion_matrix(rf.predict(X[~training]),y[~training])
rf.predict(X[~training]).ravel()
我们可能打算加快训练过程。我之前提到了这个过程,但是同时,我们可以将n_jobs设为我们想要训练的树的数量。这应该大致等于机器的核数。
rf = RandomForestClassifier(n_jobs=4, verbose=True)
rf.fit(X, y)

# 这也可以并行预测:

rf.predict(X)
4.5 使用支持向量机对数据分类
from sklearn import datasets
X, y = datasets.make_classification()

# 从支持向量机模块导入支持向量分类器(SVC):
from sklearn.svm import SVC
base_svm = SVC()
base_svm.fit(X, y)
让我们看一些属性:
C:以防我们的数据集不是分离好的,C会在间距上放大误差。随着C变大,误差的惩罚也会变大,SVM 会尝试寻找一个更窄的间隔,即使它错误分类了更多数据点。class_weight:这个表示问题中的每个类应该给予多少权重。这个选项以字典提供,其中类是键,值是与这些类关联的权重。gamma:这是用于核的 Gamma 参数,并且由rgb, sigmoid和ploy支持。kernel:这是所用的核,我们在下面使用linear核,但是rgb更流行,并且是默认选项。
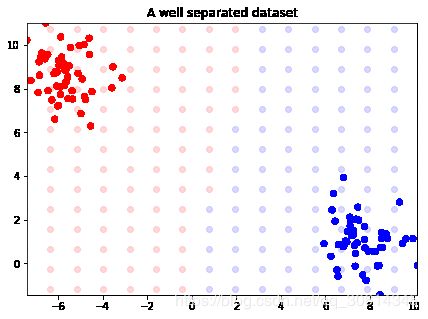
X, y = datasets.make_blobs(n_features=2, centers=2)
from sklearn.svm import LinearSVC
svm = LinearSVC()
svm.fit(X, y)
from itertools import product
from collections import namedtuple
Point = namedtuple('Point', ['x', 'y', 'outcome'])
decision_boundary = []
xmin, xmax = np.percentile(X[:, 0], [0, 100])
ymin, ymax = np.percentile(X[:, 1], [0, 100])
for xpt, ypt in product(np.linspace(xmin-2.5, xmax+2.5, 20),np.linspace(ymin-2.5, ymax+2.5, 20)):
    p = Point(xpt, ypt, svm.predict(np.array([xpt, ypt]).reshape(1,-1)))
    decision_boundary.append(p)
import matplotlib.pyplot as plt
f, ax = plt.subplots(figsize=(7, 5))
import numpy as np
colors = np.array(['r', 'b'])
for xpt, ypt, pt in decision_boundary:
    ax.scatter(xpt, ypt, color=colors[pt[0]], alpha=.15)
    ax.scatter(X[:, 0], X[:, 1], color=colors[y], s=30)
    ax.set_ylim(ymin, ymax)
    ax.set_xlim(xmin, xmax)
    ax.set_title("A well separated dataset")
plt.show()
X, y = datasets.make_classification(n_features=2,
                                        n_classes=2,
                                        n_informative=2,
                                        n_redundant=0)
首先,让我们使用新的数据点重新训练分类器。
svm.fit(X, y)
xmin, xmax = np.percentile(X[:, 0], [0, 100])
ymin, ymax = np.percentile(X[:, 1], [0, 100])
test_points = np.array([[xx, yy] for xx, yy in
                           product(np.linspace(xmin, xmax),
                           np.linspace(ymin, ymax))])
test_preds = svm.predict(test_points)
import matplotlib.pyplot as plt
f, ax = plt.subplots(figsize=(7, 5))
import numpy as np
colors = np.array(['r', 'b'])
ax.scatter(test_points[:, 0], test_points[:, 1],
               color=colors[test_preds], alpha=.25)
ax.scatter(X[:, 0], X[:, 1], color=colors[y])
ax.set_title("A well separated dataset")
plt.show()
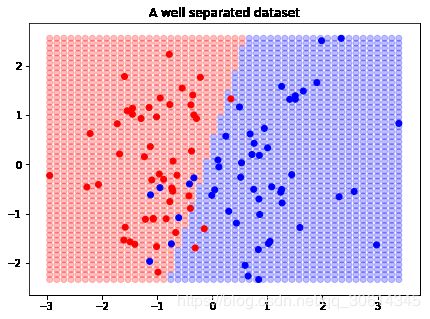
我们可以看到,决策边界并不完美,但是最后,这是我们获得的最好的线性 SVM。
随让我们可能不能获得更好的线性 SVM,Scikit 中的 SVC 分类器会使用径向基函数。我们之前看过这个函数,但是让我们观察它如何计算我们刚刚拟合的数据集的决策边界。
radial_svm = SVC(kernel='rbf')
radial_svm.fit(X, y)
xmin, xmax = np.percentile(X[:, 0], [0, 100])
ymin, ymax = np.percentile(X[:, 1], [0, 100])
test_points = np.array([[xx, yy] for xx, yy in
                           product(np.linspace(xmin, xmax),
                           np.linspace(ymin, ymax))])
test_preds = radial_svm.predict(test_points)
import matplotlib.pyplot as plt
f, ax = plt.subplots(figsize=(7, 5))
import numpy as np
colors = np.array(['r', 'b'])
ax.scatter(test_points[:, 0], test_points[:, 1],
               color=colors[test_preds], alpha=.25)
ax.scatter(X[:, 0], X[:, 1], color=colors[y])
ax.set_title("SVM with a radial basis function")
plt.show()
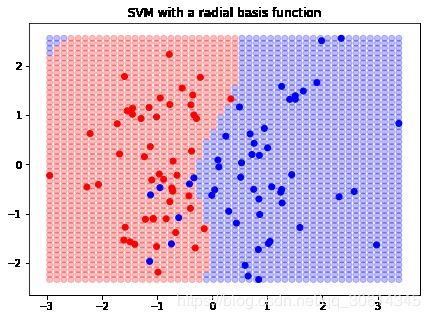
我们可以看到,决策边界改变了。我们甚至可以传入我们自己的径向基函数,如果需要的话:
def test_kernel(X, y):
    """
    Test kernel that returns the exponentiation of the dot of the X and y matrices.
    This looks an awful lot like the log hazards if you're familiar with survival analysis.
    """
    return np.exp(np.dot(X, y.T))
test_svc = SVC(kernel=test_kernel)
test_svc.fit(X, y)
4.6 使用多类分类来归纳
在处理线性模型,例如逻辑回归时,我们需要使用OneVsRestClassifier。这个模式会为每个类创建一个分类器。
from sklearn import datasets
X, y = datasets.make_classification(n_samples=10000, n_classes=3,n_informative=3)
from sklearn.tree import DecisionTreeClassifier
dt = DecisionTreeClassifier()
dt.fit(X, y)
dt.predict(X)
from sklearn.multiclass import OneVsRestClassifier
from sklearn.linear_model import LogisticRegression
mlr = OneVsRestClassifier(LogisticRegression(), n_jobs=2)
mlr.fit(X, y)
mlr.predict(X)
如果我们打算快速时间我们自己的OneVsRestClassifier,应该怎么做呢?首
先,我们需要构造一种方式,来迭代分类,并为每个分类训练分类器。之后,我们首先需要预测每个分类:
import numpy as np
def train_one_vs_rest(y, class_label):
    y_train = (y == class_label).astype(int)
    return y_train
classifiers = []
for class_i in sorted(np.unique(y)):
    l = LogisticRegression()
    y_train = train_one_vs_rest(y, class_i)
    l.fit(X, y_train)
    classifiers.append(l)
好的,所以既然我们配置好了 OneVsRest 模式,我们需要做的所有事情,就是求出每个数据点对于每个分类器的可能性。我们之后将可能性最大的分类赋给数据点。例如,让我们预测X[0]:
for classifier in classifiers:
    print(classifier.predict_proba(np.array(X[0]).reshape(1,-1)))
[[0.71518295 0.28481705]]
[[0.32110672 0.67889328]]
[[0.9040609 0.0959391]]
你可以看到,第二个分类器(下标为1)拥有“正”的最大可能性,所以我们将这个点标为1。
4.7 将 LDA 用于分类
线性判别分析(LDA)尝试拟合特征的线性组合,来预测结果变量。
import pandas as pd
from sklearn.lda import LDA
lda = LDA()
lda.fit(X.ix[:, :-1], X.ix[:, -1]);
from sklearn.metrics import classification_report
print(classification_report(X.ix[:, -1].values,lda.predict(X.ix[:, :-1])))
4.8 使用 QDA - 非线性 LDA
QDA 是一些通用技巧的推广,例如平方回归。它只是模型的推广,能够拟合更复杂的模型。但是,就像其它东西那样,当混入复杂性时,就更加困难了。
通过 QDA 对象查看平方判别分析(QDA)。
from sklearn.discriminant_analysis import QuadraticDiscriminantAnalysis as QDA
qda = QDA()
qda.fit(X.ix[:, :-1], X.ix[:, -1])
predictions = qda.predict(X.ix[:, :-1])
predictions.sum()
from sklearn.metrics import classification_report
print(classification_report(X.ix[:, -1].values, predictions))
4.9 使用随机梯度下降来分类
随机梯度下降是个用于训练分类模型的基本技巧
from sklearn import datasets
X, y = datasets.make_classification()

from sklearn import linear_model
sgd_clf = linear_model.SGDClassifier()

sgd_clf.fit(X, y)
我们可以设置class_weight参数来统计数据集中不平衡的变化总数。
Hinge 损失函数定义为:
max(0, 1 - ty)
这里,t是真正分类,+1 为一种情况,-1 为另一种情况。系数向量记为y,因为它是从模型中拟合出来的。x是感兴趣的值。这也是一种很好的度量方式。以另外一种形式表述:
t ∈ -1, 1
y = βx + b
4.10 使用朴素贝叶斯来分类数据
我们使用 Sklearn 中的newgroups数据集来玩转朴素贝叶斯模型。这是有价值的一组数据,所以我们抓取它而不是加载它。我们也将分类限制为rec.autos和rec.motorcycles。
from sklearn.datasets import fetch_20newsgroups
categories = ["rec.autos", "rec.motorcycles"]
newgroups = fetch_20newsgroups(categories=categories)

print("\n".join(newgroups.data[:1]) )
我们需要将数据处理为词频矩阵
from sklearn.feature_extraction.text import CountVectorizer
count_vec = CountVectorizer()
bow = count_vec.fit_transform(newgroups.data)

bow = np.array(bow.todense())
bow.shape
# (1192, 19177)

words = np.array(count_vec.get_feature_names())
words[bow[0] > 0][:5]
from sklearn import naive_bayes
clf = naive_bayes.GaussianNB()

mask = np.random.choice([True, False], len(bow))
clf.fit(bow[mask], newgroups.target[mask])
predictions = clf.predict(bow[~mask])

np.mean(predictions == newgroups.target[~mask])
# 0.9155405405405406
我们也可以将朴素贝叶斯扩展来执行多类分类。我们不适用高斯可能性,而是使用多项式可能性。、
from sklearn.datasets import fetch_20newsgroups
mn_categories = ["rec.autos", "rec.motorcycles","talk.politics.guns"]
mn_newgroups = fetch_20newsgroups(categories=mn_categories)

mn_bow = count_vec.fit_transform(mn_newgroups.data)
mn_bow = np.array(mn_bow.todense())

mn_mask = np.random.choice([True, False], len(mn_newgroups.data))

multinom = naive_bayes.MultinomialNB()
multinom.fit(mn_bow[mn_mask], mn_newgroups.target[mn_mask])
mn_predict = multinom.predict(mn_bow[~mn_mask])
np.mean(mn_predict == mn_newgroups.target[~mn_mask])
# 0.9585730724971231
4.11 标签传递,半监督学习
标签传递是个半监督学习技巧,它利用带标签和不带标签的数据,来了解不带标签的数据。
from sklearn import datasets
d = datasets.load_iris()
由于我们会将数据搞乱,我们做一个备份,并向标签名称数组的副本添加一个unlabeled成员。它会使数据的识别变得容易。
X = d.data.copy()
y = d.target.copy()
names = d.target_names.copy()
names = np.append(names, ['unlabeled'])
names
# array(['setosa', 'versicolor', 'virginica', 'unlabeled'], dtype='
y[:10]
# array([ 0, 0, -1, 0, 0, -1, 0, 0, -1, -1])
names[y[:10]]
# array(['setosa', 'setosa', 'unlabeled', 'setosa', 'setosa', 'unlabeled',
# 'setosa', 'setosa', 'unlabeled', 'unlabeled'], dtype='我们显然拥有一大堆未标注的数据,现在的目标是使用LabelPropagation来预测标签:
from sklearn import semi_supervised
lp = semi_supervised.LabelPropagation()
lp.fit(X, y)

preds = lp.predict(X)
(preds == d.target).mean()
# 0.9866666666666667
让我们看看LabelSpreading,它是LabelPropagation的姐妹类
ls = semi_supervised.LabelSpreading()
ls.fit(X, y)
(ls.predict(X) == d.target).mean()
# 0.98
第五章 模型后处理
本章包括以下主题:
- [K-fold 交叉验证]
- [自动化交叉验证]
- [使用 ShuffleSplit 交叉验证]
- [分层的 k-fold]
- [菜鸟的网格搜索]
- [爆破网格搜索]
- [使用伪造的估计器来比较结果]
- [回归模型评估]
- [特征选取]
- [L1 范数上的特征选取]
- [使用 joblib 保存模型]
5.1 K-fold 交叉验证
N = 1000
holdout = 200
from sklearn.datasets import make_regression
X, y = make_regression(1000, shuffle=True)

X_h, y_h = X[:holdout], y[:holdout]
X_t, y_t = X[holdout:], y[holdout:]
from sklearn.model_selection import KFold

kf = KFold(5, random_state=123)

for train,test in kf.split(X,y):
    print(len(train),len(test))
k-fold 的原理是迭代折叠,并保留1/n_folds * N个数据,其中N是我们的len(y_t)。
import numpy as np
import pandas as pd
patients = np.repeat(np.arange(0, 100, dtype=np.int8), 8)
measurements = pd.DataFrame({'patient_id': patients,'ys': np.random.normal(0, 1, 800)})
import numpy as np
import pandas as pd
patients = np.repeat(np.arange(0, 100, dtype=np.int8), 8)
measurements = pd.DataFrame({'patient_id': patients,'ys': np.random.normal(0, 1, 800)})

measurements.head()
custids = np.unique(measurements.patient_id)
customer_kfold = KFold(4, random_state=123)
for train,test in customer_kfold.split(custids):
    train_cust_ids = custids[train]
    training = measurements[measurements.patient_id.isin(train_cust_ids)]
    testing = measurements[~measurements.patient_id.isin(train_cust_ids)]
    print(len(training),len(testing))
5.2 自动化交叉验证
from sklearn import ensemble
rf = ensemble.RandomForestRegressor(max_features='auto')

from sklearn import datasets
X, y = datasets.make_regression(10000, 10)

from sklearn.model_selection import cross_val_score
scores = cross_val_score(rf, X, y)

print(scores)
# [0.85050299 0.85524044 0.85971237]
scores =cross_val_score(rf, X, y, verbose=3,cv=4)
# [CV] ....................... , score=0.8563404826144201, total=   0.3s
# [Parallel(n_jobs=1)]: Done   4 out of   4 | elapsed:    1.5s finished
5.3 使用 ShuffleSplit 交叉验证
ShuffleSplit是最简单的交叉验证技巧之一。这个交叉验证技巧只是将数据的样本用于指定的迭代数量。
import numpy as np
true_loc = 1000
true_scale = 10
N = 1000
dataset = np.random.normal(true_loc, true_scale, N)
import matplotlib.pyplot as plt
f, ax = plt.subplots(figsize=(7, 5))
ax.hist(dataset, color='k', alpha=.65, histtype='stepfilled');
ax.set_title("Histogram of dataset");
plt.show()
f.savefig("978-1-78398-948-5_06_06.png")
holdout_set = dataset[:500]
fitting_set = dataset[500:]
estimate = fitting_set[:int(N/2)].mean()
import matplotlib.pyplot as plt
f, ax = plt.subplots(figsize=(7, 5))
ax.set_title("True Mean vs Regular Estimate")
ax.vlines(true_loc, 0, 1, color='r', linestyles='-', lw=5,
              alpha=.65, label='true mean')
ax.vlines(estimate, 0, 1, color='g', linestyles='-', lw=5,
              alpha=.65, label='regular estimate')
ax.set_xlim(999, 1001)
ax.legend()
plt.show()
f.savefig("978-1-78398-948-5_06_07.png")

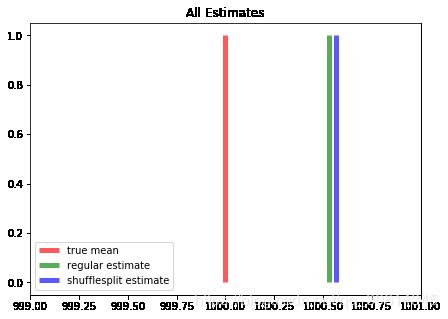
现在,我们可以使用ShuffleSplit在多个相似的数据集上拟合估计值。
from sklearn.model_selection import ShuffleSplit
shuffle_split = ShuffleSplit(n_splits=5, random_state=0)
mean_p=[]
for train_index, test_index in shuffle_split.split(fitting_set):
    print("TRAIN:", len(train_index), "TEST:", len(test_index))
    mean_p.append(fitting_set[train_index].mean())
    shuf_estimate = np.mean(mean_p)

import matplotlib.pyplot as plt
f, ax = plt.subplots(figsize=(7, 5))
ax.vlines(true_loc, 0, 1, color='r', linestyles='-', lw=5,
              alpha=.65, label='true mean')
ax.vlines(estimate, 0, 1, color='g', linestyles='-', lw=5,
              alpha=.65, label='regular estimate')
ax.vlines(shuf_estimate, 0, 1, color='b', linestyles='-', lw=5,
              alpha=.65, label='shufflesplit estimate')
ax.set_title("All Estimates")
ax.set_xlim(999, 1001)
ax.legend(loc=3)
plt.show()
5.4 分层的 k-fold
from sklearn import datasets
X, y = datasets.make_classification(n_samples=int(1e3),weights=[1./11])
y.mean()
# 0.902
# 90.2% 的样本都是 1,其余为 0。

from sklearn.model_selection import StratifiedKFold
from sklearn.model_selection import ShuffleSplit

n_folds = 50
strat_kfold = StratifiedKFold(n_splits=n_folds)
shuff_split = ShuffleSplit(n_splits=n_folds)
kfold_y_props = []
shuff_y_props = []
for (k_train, k_test), (s_train, s_test) in zip(strat_kfold.split(X,y),
shuff_split.split(X)):
    kfold_y_props.append(y[k_train].mean())
    shuff_y_props.append(y[s_train].mean())

import matplotlib.pyplot as plt
f, ax = plt.subplots(figsize=(7, 5))
ax.plot(range(n_folds), shuff_y_props, label="ShuffleSplit",
            color='k')
ax.plot(range(n_folds), kfold_y_props, label="Stratified",
            color='k', ls='--')
ax.set_title("Comparing class proportions.")
ax.legend(loc='best')
plt.show()
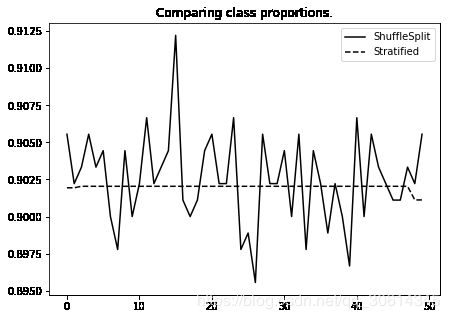
分层 k-fold 的原理是选取y值。首先,获取所有分类的比例,之后将训练集和测试集按比例划分。这可以推广到多个标签:
import numpy as np
X=np.arange(2000).reshape(1000,2)
three_classes = np.random.choice([1,2,3], p=[.1, .4, .5],size=1000)
import itertools as it
sk=StratifiedKFold(n_splits=5)
for train,test in sk.split(X,three_classes):
    print(np.bincount(three_classes[train]))
5.5 菜鸟的网格搜索
我们会执行下面这些东西:
- 在参数空间中设计基本的搜索网格。
- 迭代网格并检查数据集的参数空间中的每个点的损失或评分函数。
- 选取参数空间中的点,它使评分函数最大或者最小。
同样,我们训练的模型是个基本的决策树分类器。我们的参数空间是 2 维的,有助于我们可视化。
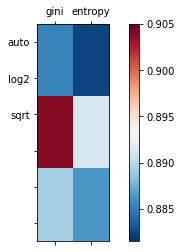
我们使用网格搜索来调整两个参数 – criteria和max_features和criteria和max_features。我们需要将其表示为 Python 集合,之后使用itertools.product来迭代它们。
from sklearn import datasets
X, y = datasets.make_classification(n_samples=2000, n_features=10)
创建笛卡尔积
import itertools
class cartesian(object):
    def __init__(self):
        self._data_list=[]
    def add_data(self,data=[]): #添加生成笛卡尔积的数据列表
        self._data_list.append(data)
    def build(self): #计算笛卡尔积
        dke=[]
        for item in itertools.product(*self._data_list):
            print(item)
            dke.append(item)
        return dke

car=cartesian()
criteria = ["gini", "entropy"]
max_features = ["auto", "log2", "sqrt"]
car.add_data(criteria)
car.add_data(max_features)
parameter_space=car.build()
import numpy as np
train_set = np.random.choice([True, False], size=len(y))
from sklearn.tree import DecisionTreeClassifier
accuracies = {}
for criterion, max_feature in parameter_space:
    dt = DecisionTreeClassifier(criterion=criterion,max_features=max_feature)
    dt.fit(X[train_set], y[train_set])
    accuracies[(criterion, max_feature)] = (dt.predict(X[~train_set])
    == y[~train_set]).mean()
from matplotlib import pyplot as plt
from matplotlib import cm
cmap = cm.RdBu_r
f, ax = plt.subplots(figsize=(7, 4))
ax.set_xticklabels([''] + list(criteria))
ax.set_yticklabels([''] + list(max_features))
plot_array = []
for max_feature in max_features:
    m = []
    for criterion in criteria:
        m.append(accuracies[(criterion, max_feature)])
        plot_array.append(m)
colors = ax.matshow(plot_array, vmin=np.min(list(accuracies.values()))-0.001,
 vmax=np.max(list(accuracies.values())) + 0.001, cmap=cmap)
f.colorbar(colors)
plt.show()
5.6 爆破网格搜索
from sklearn.datasets import make_classification
X, y = make_classification(1000, n_features=5)

from sklearn.linear_model import LogisticRegression
lr = LogisticRegression()

lr.fit(X, y)
import scipy.stats as st
import numpy as np
random_search_params = {'penalty': ['l1', 'l2'], 'C': st.randint(1, 4)}

from sklearn.model_selection import GridSearchCV, RandomizedSearchCV
gs = GridSearchCV(lr, grid_search_params)
gs.fit(X, y)

gs.cv_results_['mean_test_score']

gs.cv_results_['params']

gs.best_score_

for key in gs.cv_results_:
    print(key)
5.7 使用伪造的估计器来比较结果
为最后构建的模型创建一个参照点
会执行下列任务:
创建一些随机数据
训练多种伪造的估计器
我们会对回归数据和分类数据来执行这两个步骤。
X, y = make_regression()
from sklearn import dummy
dumdum = dummy.DummyRegressor()
dumdum.fit(X, y)

dumdum.predict(X)[:5]
我们可以尝试另外两种策略。我们可以提供常数来做预测(就是下面命令中的constant=None),也可以使用中位值来预测。如果策略是constant,才会使用提供的常数。
predictors = [("mean", None),("median", None),("constant", 10)]
for strategy, constant in predictors:
    dumdum = dummy.DummyRegressor(strategy=strategy,constant=constant)
    dumdum.fit(X, y)
    print("strategy: {}".format(strategy), ",".join(map(str,dumdum.predict(X)[:5])))
们实际上有四种分类器的选项。这些策略类似于连续情况,但是适用于分类问题:
predictors = [("constant", 0),("stratified", None),("uniform", None),("most_frequent", None)]

X, y = datasets.make_classification()
for strategy, constant in predictors:
    dumdum = dummy.DummyClassifier(strategy=strategy,constant=constant)
    dumdum.fit(X, y)
    print("strategy: {}".format(strategy), ",".join(map(str,dumdum.predict(X)[:5])))
最好在最简单的模型上测试你的模型,这就是伪造的估计器的作用。例如,在一个模型中,5% 的数据是伪造的。所以,我们可能能够训练出一个漂亮的模型,而不需要猜测任何伪造。
X, y = datasets.make_classification(20000, weights=[.95, .05])
dumdum = dummy.DummyClassifier(strategy='most_frequent')
dumdum.fit(X, y)

from sklearn.metrics import accuracy_score
print(accuracy_score(y, dumdum.predict(X)))
5.8 回归模型评估
m = 2
b = 1
y = lambda x: m * x + b

import numpy as np
import matplotlib.pyplot as plt
from sklearn import metrics

def data(x, m=2, b=1, e=None, s=10):
    """
    Args:
        x: The x value
        m: Slope
        b: Intercept
        e: Error, optional, True will give random error
    """
    if e is None:
        e_i = 0
    elif e is True:
        e_i = np.random.normal(0, s, len(xs))
    else:
        e_i = e
    return x * m + b + e_i
from functools import partial
N = 100
xs = np.sort(np.random.rand(N)*100)
y_pred_gen = partial(data, x=xs, e=True)
y_true_gen = partial(data, x=xs)
y_pred = y_pred_gen()
y_true = y_true_gen()
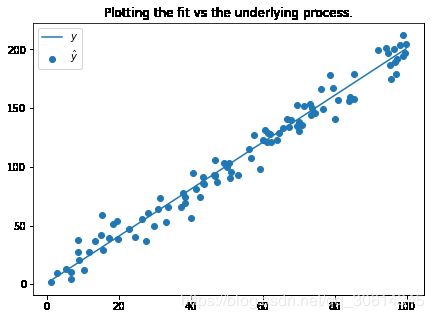
f, ax = plt.subplots(figsize=(7, 5))
ax.set_title("Plotting the fit vs the underlying process.")
ax.scatter(xs, y_pred, label=r'$\hat{y}$')
ax.plot(xs, y_true, label=r'$y$')
ax.legend(loc='best')
plt.show()
e_hat = y_pred - y_true
f, ax = plt.subplots(figsize=(7, 5))
ax.set_title("Residuals")
ax.hist(e_hat, color='r', alpha=.5, histtype='stepfilled')
plt.show()
# 你可以使用下面的代码来计算均方误差值:
metrics.mean_squared_error(y_true, y_pred)
# 89.2452508752873
rsq = 1 - ((y_trus - y_pred) ** 2).sum() / ((y_trus - y_trus.mean()) ** 2).sum()
metrics.r2_score(y_true, y_pred)
# 0.9719221677589868
5.9 特征选取
# 带有 10000 个特征的回归模型,但是只有 1000 个点
from sklearn import datasets
X, y = datasets.make_regression(1000, 10000)

from sklearn import feature_selection
f, p = feature_selection.f_regression(X, y)
这里,f就是和每个线性模型的特征之一相关的 f 分数。我们之后可以比较这些特征,并基于这个比较,我们可以筛选特征。p是f值对应的 p 值。
f.shape
# (10000,)

f[:5]
# array([0.66406272, 1.35755509, 0.04772681, 0.02917001, 0.84855673])

p.shape
# (10000,)
p[:5]
# array([0.41532372, 0.24424006, 0.82711174, 0.8644217 , 0.35718357])
选取小于.05的p值。这些就是我们用于分析的特征。
import numpy as np
idx = np.arange(0, X.shape[1])
features_to_keep = idx[p < .05]
len(features_to_keep)
# 495
另一个选择是使用VarianceThreshold对象。我们已经了解一些了。但是重要的是理解,我们训练模型的能力,基本上是基于特征所产生的变化。如果没有变化,我们的特征就不能描述独立变量的变化。
根据文档,良好的特征可以用于非监督案例,因为它并不是结果变量。我们需要设置起始值来筛选特征。为此,我们选取并提供特征方差的中位值。
var_threshold = feature_selection.VarianceThreshold(np.median(np.var(X, axis=1)))
var_threshold.fit_transform(X).shape
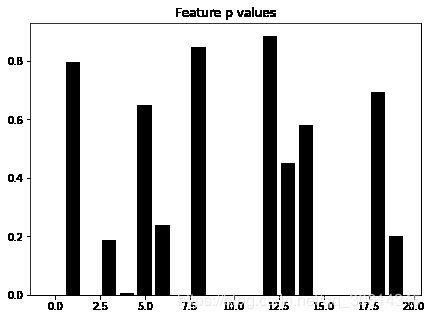
让我们观察一个更小的问题,并可视化特征选取如何筛选特定的特征。我们使用第一个示例的相同评分函数,但是仅仅有 20 个特征。
X, y = datasets.make_regression(10000, 20)
f, p = feature_selection.f_regression(X, y)

from matplotlib import pyplot as plt
f, ax = plt.subplots(figsize=(7, 5))
ax.bar(np.arange(20), p, color='k')
ax.set_title("Feature p values")
plt.show()
5.10 L1 范数上的特征选取
# 首先加载数据集:
import sklearn.datasets as ds
diabetes = ds.load_diabetes()

# 让我们导入度量模块的mean_squared_error函数,以及cross_validation模块的ShuffleSplit交叉验证函数。
from sklearn import metrics
from sklearn.model_selection import ShuffleSplit
shuff =ShuffleSplit(n_splits=5, test_size=0.2, random_state=0)

# 现在训练模型,我们会跟踪ShuffleSplit每次迭代中的均方误差。
mses = []
for train, test in shuff.split(diabetes.target):
        train_X = diabetes.data[train]
        train_y = diabetes.target[train]
        test_X = diabetes.data[~train]
        test_y = diabetes.target[~train]
        lr.fit(train_X, train_y)
        mses.append(metrics.mean_squared_error(test_y,lr.predict(test_X)))
np.mean(mses)

#所以既然我们做了常规拟合,让我们在筛选系数为 0 的特征之后再检查它。让我们训练套索回归:
from sklearn import feature_selection
from sklearn import linear_model
cv = linear_model.LassoCV()
cv.fit(diabetes.data, diabetes.target)
cv.coef_
import numpy as np
columns = np.arange(diabetes.data.shape[1])[cv.coef_ != 0]
columns

l1mses = []
for train, test in shuff.split(diabetes.target):
    train_X = diabetes.data[train][:, columns]
    train_y = diabetes.target[train]
    test_X = diabetes.data[~train][:, columns]
    test_y = diabetes.target[~train]
    lr.fit(train_X, train_y)
    l1mses.append(metrics.mean_squared_error(test_y,lr.predict(test_X)))
np.mean(l1mses)

np.mean(l1mses) - np.mean(mses)
工作原理
X, y = ds.make_regression(noise=5)

lr=LogisticRegression()
mses = []
shuff =ShuffleSplit(n_splits=5, test_size=0.2, random_state=0)
for train, test in shuff.split(y):
    train_X = X[train]
    train_y = y[train]
    test_X = X[~train]
    test_y = y[~train]
    lr.fit(train_X, train_y.astype(int))
    mses.append(metrics.mean_squared_error(test_y,lr.predict(test_X)))
np.mean(mses)

cv.fit(X, y)

import numpy as np
columns = np.arange(X.shape[1])[cv.coef_ != 0]
columns[:5]
mses = []
shuff = ShuffleSplit(n_splits=5)
for train, test in shuff.split(y):
    train_X = X[train][:, columns]
    train_y = y[train]
    test_X = X[~train][:, columns]
    test_y = y[~train]
    lr.fit(train_X, train_y.astype(int))
    mses.append(metrics.mean_squared_error(test_y, lr.predict(test_X)))
np.mean(mses)
5.11 使用 joblib 保存模型
from sklearn import datasets, tree
X, y = datasets.make_classification()
dt = tree.DecisionTreeClassifier()
dt.fit(X, y)

from sklearn.externals import joblib
joblib.dump(dt, "dtree.clf")
from sklearn import ensemble
rf = ensemble.RandomForestClassifier()
rf.fit(X, y)

joblib.dump(rf, "rf.clf")

