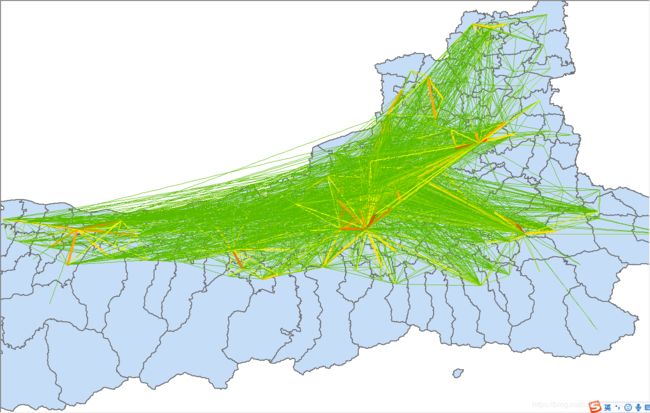
WebGIS_Javascript_在mapbox展示客流OD线状图
mapbox展示客流OD线状图的步骤如下:
1、首先引入mapbox
2、获取数据
3、将数据转为mapbox能识别的geojson格式
4、调用mapbox的addSource和addLayer方法将线状图层添加上mapbox
注意:线条数据分段请参考本条sql语句:
分为6段的话就截取六个分段的节点值,那样效果比较好看!
select distinct(od) from od_street_line_201911 order by od
数据来源请参考我这篇文章:
python_pandas_将街道行政区级别的数据进行分组求和
let addFlowOdLayer = function () {
/*距离筛选*/
$('#od_length_slider').attr("disabled", false);
$("#od_length_slider").val(0);
$("#od_length_label").text("大于0千米")
$('#od_count_slider').attr("disabled", false);
$("#od_count_slider").val(0);
$("#od_count_label").text("大于0");
const odShowWay = $('input:radio[name="displayways_od"]:checked').val();
const basicUrl_inner = `${SEARCH_CONFIG.OD}?year=2018&scale=street`;
// addBasicLayer('街道');
addBasicLayer('区');
let addTaxiodByhour = function () {
$.ajax({
url: basicUrl_inner,
dataType: "text",
success: function (data) {
data = JSON.parse(data);
const dataArray = data.data;
if (dataArray.length === 0) {
}
let arcsDataCreator_line = function () {
const allParsedFeatures = {
"type": "FeatureCollection",
"features": []
};
for (let i = 0; i < dataArray.length; i++) {
const {center_lon,center_lat, center_l_1, center_l_2, od} = dataArray[i];
const start = [parseFloat(center_lon), parseFloat(center_lat)];
const end = [parseFloat(center_l_1), parseFloat(center_l_2)];
let oneFeatureParsed = {
type: "Feature",
properties: {od_count: parseInt(od)},
geometry: {type: "LineString", coordinates: [start, end]}
};
allParsedFeatures.features.push(oneFeatureParsed)
}
return allParsedFeatures;
}
let addOdLayersHere = function (data) {
if (mapOutParam.map.getLayer("taxi_street_od_layer_level1")) {
mapOutParam.map.removeLayer("taxi_street_od_layer_level1")
}
if (mapOutParam.map.getLayer("taxi_street_od_layer_level2")) {
mapOutParam.map.removeLayer("taxi_street_od_layer_level2")
}
if (mapOutParam.map.getLayer("taxi_street_od_layer_level3")) {
mapOutParam.map.removeLayer("taxi_street_od_layer_level3")
}
if (mapOutParam.map.getLayer("taxi_street_od_layer_level4")) {
mapOutParam.map.removeLayer("taxi_street_od_layer_level4")
}
if (mapOutParam.map.getLayer("taxi_street_od_layer_level5")) {
mapOutParam.map.removeLayer("taxi_street_od_layer_level5")
}
if (mapOutParam.map.getLayer("taxi_street_od_layer_level6")) {
mapOutParam.map.removeLayer("taxi_street_od_layer_level6")
}
if (mapOutParam.map.getLayer("od_layer")) {
mapOutParam.map.removeLayer("od_layer")
}
if (mapOutParam.map.getSource("od_layer")) {
mapOutParam.map.removeSource("od_layer")
}
mapOutParam.map.addSource('od_layer', {
"type": "geojson",
"data": data,
'lineMetrics': true
});
mapOutParam.map.addLayer({
"id": "taxi_street_od_layer_level1",
"source": "od_layer",
"type": "line",
"filter": ["<=", "od_count", 837],
"paint": {
"line-color": "#0000ff", //4f55ff
"line-width": 0.4,
"line-opacity":1
}
})
mapOutParam.map.addLayer({
"id": "taxi_street_od_layer_level2",
"source": "od_layer",
"type": "line",
"filter": ["all", [">", "od_count", 837], ["<=", "od_count", 1833]],
"paint": {
"line-color": "#3333ff", //76b4d5
"line-width": 0.6,
"line-opacity": 1
}
})
mapOutParam.map.addLayer({
"id": "taxi_street_od_layer_level3",
"source": "od_layer",
"type": "line",
"filter": ["all", [">", "od_count", 1833], ["<=", "od_count", 3302]],
"paint": {
"line-color": "#6666ff", //cfe3ed
"line-width": 0.9,
"line-opacity": 1
}
})
mapOutParam.map.addLayer({
"id": "taxi_street_od_layer_level4",
"source": "od_layer",
"type": "line",
"filter": ["all", [">", "od_count", 3302], ["<=", "od_count", 6171]],
"paint": {
"line-color": "#9999ff", //f6d7c8
"line-width": 1,
"line-opacity": 1
}
})
mapOutParam.map.addLayer({
"id": "taxi_street_od_layer_level5",
"source": "od_layer",
"type": "line",
"filter": ["all", [">", "od_count", 6171], ["<=", "od_count", 13861]],
"paint": {
"line-color": "#ccccff", //ec846e
"line-width": 1,
"line-opacity": 1
}
})
mapOutParam.map.addLayer({
"id": "taxi_street_od_layer_level6",
"source": "od_layer",
"type": "line",
"filter": ["all", [">", "od_count", 13861], ["<=", "od_count", 1077616]],
"paint": {
"line-color": "#ffffff", //ca0020
"line-width": 1.2,
"line-opacity": 1
}
})
}
let renderLayers_arc = function (arcs) {
let WIDTH_SCALE = d3.scaleLinear().domain([0, 100]).range([1, 4]);
if (mapOutParam.map.getLayer("all_od_arcs")) {
mapOutParam.map.removeLayer("all_od_arcs")
}
var arcsLayer_arc = new MapboxLayer({
type: ArcLayer,
id: "all_od_arcs",
data: arcs,
pickable: true,
autoHighlight: true,
fp64: true,
getStrokeWidth: d => WIDTH_SCALE(d.value),
opacity: 1,
renderingMode: "3d",
getSourcePosition: d => d.source,
getTargetPosition: d => d.target,
getSourceColor: [35, 181, 184],
getTargetColor: [166, 3, 3],
onClick: function () {
alert("aaaaaa")
},
});
mapOutParam.map.addLayer(arcsLayer_arc);
}
if (odShowWay !== "show_all") {
const length_filter = document.getElementById('od_length_slider').value;
const count_filter = document.getElementById('od_count_slider').value;
}
else if (odShowWay === "show_all") {
const length_filter = document.getElementById('od_length_slider').value;
const count_filter = document.getElementById('od_count_slider').value;
const arcs_new = arcsDataCreator_line();
// chartFunction.sortedTraffic_OD(arcs_new)
console.log(arcs_new);
addOdLayersHere(arcs_new);
}
},
error: function (data, textStatus, errorThrown) {
}
});
}
addTaxiodByhour()
}
如需完整代码和数据示例请私聊我。。。
如果比较急的话请打开我其他文章获得我的联系方式:
我的文章
