pytorch框架使用LSTM预测股票价格
1.代码
# -*- coding: utf-8 -*-
# @Time    : 2020/5/11 11:18

import matplotlib.pyplot as plt
from sklearn.preprocessing import MinMaxScaler
import numpy as np
import tushare as ts
import torch
from torch import nn

DAYS_FOR_TRAIN = 10
EPOCHS = 1000


class LSTM_Regression(nn.Module):
    """
        使用LSTM进行回归

        参数:
        - input_size: feature size
        - hidden_size: number of hidden units
        - output_size: number of output
        - num_layers: layers of LSTM to stack
    """

    def __init__(self, input_size, hidden_size, output_size=1, num_layers=2):
        super().__init__()

        self.lstm = nn.LSTM(input_size, hidden_size, num_layers)
        self.fc = nn.Linear(hidden_size, output_size)

    def forward(self, _x):
        x, _ = self.lstm(_x)  # _x is input, size (seq_len, batch, input_size)
        s, b, h = x.shape  # x is output, size (seq_len, batch, hidden_size)
        x = x.view(s * b, h)
        x = self.fc(x)
        x = x.view(s, b, -1)  # 把形状改回来
        return x


def create_dataset(data, days_for_train=5) -> (np.array, np.array):
    """
        根据给定的序列data,生成数据集。
        数据集分为输入和输出,每一个输入的长度为days_for_train,每一个输出的长度为1。
        也就是说用days_for_train天的数据,对应下一天的数据。
        若给定序列的长度为d,将输出长度为(d-days_for_train)个输入/输出对
    """
    dataset_x, dataset_y = [], []
    for i in range(len(data) - days_for_train):
        _x = data[i:(i + days_for_train)]
        dataset_x.append(_x)
        dataset_y.append(data[i + days_for_train])
    return (np.array(dataset_x), np.array(dataset_y))


if __name__ == '__main__':

    # 取上证指数的收盘价
    share_prices = ts.get_k_data('000001', start='2018-01-01', index=True)[
        'close'].values
    share_prices = share_prices.astype('float32')  # 转换数据类型: obj ->float

    # 上证指数收盘价作图
    plt.plot(share_prices)
    plt.savefig('share_prices.png', format='png', dpi=200)
    plt.close()

    # 将数据集标准化到 [-1,1] 区间
    scaler = MinMaxScaler(feature_range=(-1, 1))  # train data normalized
    share_prices = scaler.fit_transform(share_prices.reshape(-1, 1))

    # 数据集序列化,进行标签分离
    dataset_x, dataset_y = create_dataset(share_prices, DAYS_FOR_TRAIN)

    # 划分训练集和测试集,70%作为训练集,30%作为测试集
    train_size = int(len(dataset_x) * 0.7)
    train_x = dataset_x[:train_size]
    train_y = dataset_y[:train_size]
    test_x = dataset_x[train_size:]
    test_y = dataset_y[train_size:]

    # 改变数据集形状,RNN 读入的数据维度是 (seq_size, batch_size, feature_size)
    train_x = train_x.reshape(-1, 1, DAYS_FOR_TRAIN)
    train_y = train_y.reshape(-1, 1, 1)

    # 数据集转为pytorch的tensor对象
    train_x = torch.from_numpy(train_x)
    train_y = torch.from_numpy(train_y)

    # train model
    model = LSTM_Regression(DAYS_FOR_TRAIN, 8, output_size=1, num_layers=2)  # 网络初始化
    loss_function = nn.MSELoss()  # 损失函数
    optimizer = torch.optim.Adam(model.parameters(), lr=1e-2)  # 优化器
    for epoch in range(EPOCHS):
        out = model(train_x)
        loss = loss_function(out, train_y)
        loss.backward()
        optimizer.step()
        optimizer.zero_grad()
        if (epoch + 1) % 100 == 0:
            print('Epoch: {}, Loss:{:.5f}'.format(epoch + 1, loss.item()))
    # torch.save(model.state_dict(), 'model_params.pkl')  # 可以保存模型的参数供未来使用

    # predict
    model = model.eval()  # 转换成测试模式
    # model.load_state_dict(torch.load('model_params.pkl'))  # 读取参数
    # 使用全部数据集dataset_x,模型的输出长度会比dataset_x少 DAYS_FOR_TRAIN
    dataset_x = dataset_x.reshape(-1, 1, DAYS_FOR_TRAIN)  # (seq_size, batch_size, feature_size)
    dataset_x = torch.from_numpy(dataset_x)  # 转为pytorch的tensor对象

    pred_y = model(dataset_x)  # 全量数据集的模型输出 (seq_size, batch_size, output_size)
    pred_y = pred_y.view(-1).data.numpy()

    # 对标准化数据进行还原
    actual_pred_y = scaler.inverse_transform(pred_y.reshape(-1, 1))
    actual_pred_y = actual_pred_y.reshape(-1, 1).flatten()

    test_y = scaler.inverse_transform(test_y.reshape(-1, 1))
    test_y = test_y.reshape(-1, 1).flatten()

    actual_pred_y = actual_pred_y[-len(test_y):]
    test_y = test_y.reshape(-1, 1)
    assert len(actual_pred_y) == len(test_y)

    # 初始结果 - 预测结果
    plt.plot(actual_pred_y, 'r', label='prediction')
    plt.plot(test_y, 'b', label='real')
    plt.plot((len(actual_pred_y), len(test_y)), (0, 1), 'g--')  # 分割线 左边是训练数据 右边是测试数据的输出
    plt.legend(loc='best')
    plt.savefig('result.png', format='png', dpi=200)
    plt.close()
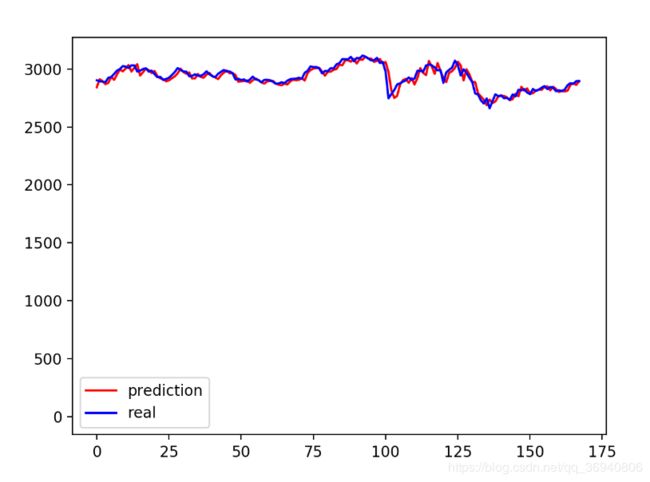
2.真实结果与预测结果对比
