【无聊】opencv与图像处理基础之车道线检测
车道线检测
参考:opencv在python中的哈夫直线变换(Hough Line Transform) https://www.jianshu.com/p/ebaf449b434b

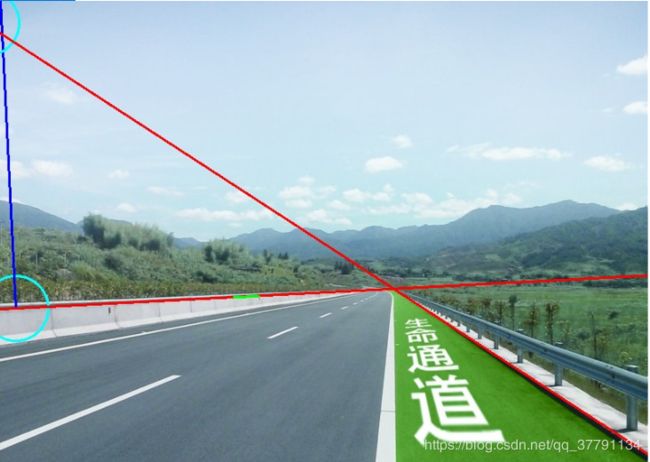
其中第一条直线,以及与中心点垂直的直线示意图如下,分别是红色线和蓝色线,如上图,为啥呢?首先200阈值导致只有两根线,如果设置为100,则有许多线,这个是经验值。lines[i][0][0]表示极坐标半径,lines[i][0][1]表示极坐标角度,这个是切点。所以连接原点的线与所得直线垂直。
结果:

#coding: utf8
import cv2
import numpy as np
import matplotlib.pyplot as plt

##首先检测边缘
img = cv2.imread('lane.jpg')

plt.figure()
plt.subplot(221)
plt.title("org pic")
img_src_rgb = cv2.cvtColor(img,cv2.COLOR_BGR2RGB)
img_src_rgb_p = img_src_rgb
plt.imshow(img_src_rgb)

gray = cv2.cvtColor(img, cv2.COLOR_BGR2GRAY)
gaus = cv2.GaussianBlur(gray, (5, 5), 0)
lowth = 80
highth = lowth * 3
edges = cv2.Canny(gaus, lowth, highth, apertureSize=3)

##然后检测直线
height,width=gray.shape


#(函数参数3和参数4) 通过步长为1的半径和步长为π/180的角来搜索所有可能的直线
# 200 --是经过某一点曲线的数量的阈值
lines = cv2.HoughLines(edges,1,np.pi/180,200)  #这里对最后一个参数使用了经验型的值
print(lines.size)
print(lines.shape)
print(lines)
print("gray image size=",gray.shape)
print("lines[0]",lines[0])


for i in range(0,len(lines)):
    rho,theta = lines[i][0][0],lines[i][0][1]
    print(theta)  ## 角度
    print(rho)    ## 半径大小
    a = np.cos(theta) ##x方向偏移
    b = np.sin(theta) ##y方向偏移
    x0 = a*rho
    y0 = b*rho

    ##右无穷点
    x1 = int(x0 + 1000*(-b))
    y1 = int(y0 + 1000*(a))
    ##左无穷点
    x2 = int(x0 - 1000*(-b))
    y2 = int(y0 - 1000*(a))

    print("x0=",x0,"x1=",x1,"x2=",x2)
    print("y0=",y0,"y1=",y1,"y2=",y2)

    cv2.circle(img_src_rgb,(int(x0),int(y0)),40,(255,255,0),2,8,0) ##画出切点
    # img:输入的图片data
    # center:圆心位置
    # radius:圆的半径
    # color:圆的颜色
    # thickness:圆形轮廓的粗细(如果为正)。负厚度表示要绘制实心圆。
    # lineType: 圆边界的类型。
    # shift:中心坐标和半径值中的小数位数。
    cv2.line(img_src_rgb,(0,0),(x0,y0),(255,0,0),2) ##画出半径
    cv2.line(img_src_rgb,(x1,y1),(x2,y2),(0,0,255),2) ##画出直线


minLineLength  =  100
maxLineGap  =  30
lines  =  cv2.HoughLinesP(edges,1,np.pi/180,200,minLineLength,maxLineGap)
for  x1,y1,x2,y2  in  lines[0]:
    cv2.line(img_src_rgb_p,(x1,y1),(x2,y2),(0,255,0),2)


plt.subplot(222)
plt.title("edges")
plt.imshow(edges,cmap="gray")

plt.subplot(223)
plt.title("HoughLines")
plt.imshow(img_src_rgb,cmap="gray")


plt.subplot(224)
plt.title("HoughLinesP")
plt.imshow(img_src_rgb_p,cmap="gray")

plt.show()

# cv2.imwrite('HoughLinesP.jpg',img_src_rgb_p)
# cv2.imwrite("houghlie.jpg",img_src_rgb)
# cv2.waitKey(0)