Python Seaborn: 常见的画图与保存方法总结
Python Seaborn: 常见的画图与保存方法总结
本文章主要包括了散点图、频率分布图、箱型图、热力图和多变量图的绘制与保存方法。
1. Scatterplot 散点图
绘图与保存的方法:
 data = sns.load_dataset("tips")
 filepath = 'C:/Users'
 fig_name = 'scatterplot.png'

# fig_path为想要存入的文件夹或地址
 fig_path = filepath + '/' + fig_name
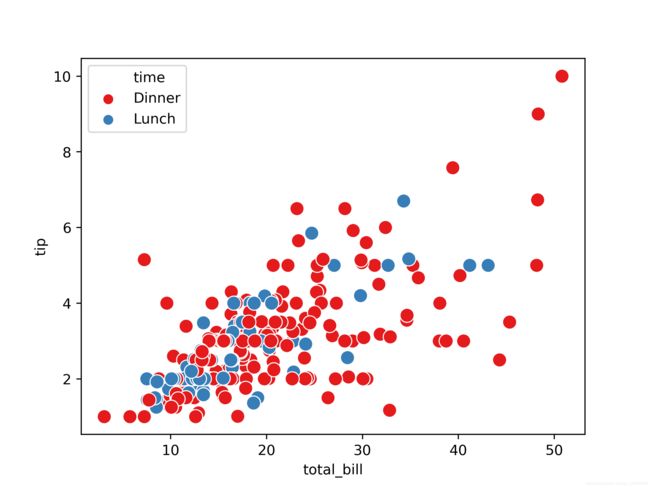
 fig = sns.scatterplot(x = data['total_bill'], y = data['tip'], hue = 'time',
                data = data, palette = 'Set1', s = 100)
 scatter_fig = fig.get_figure()
 scatter_fig.savefig(fig_path, dpi = 400)
其中,
sns.scatterplot()为seaborn绘制散点图,里面的s为marker size, palette为图的颜色样式;
.get_figure()为获取散点图;
.savefig()为保存散点图;
dpi为每英寸点数(dots per inch)。
2. Distplot 频率分布图
绘图与保存的方法:
x = np.random.randn(100)
x = pd.Series(x, name = "x variable")
ax = sns.distplot(x)
hist_fig = ax.get_figure()
hist_fig.savefig(fig_path, dpi = 400)
其中,sns.distplot()为绘制分布图的方法。
3. Boxplot 箱型图
绘图与保存的方法:
fig_dims = (7.5, 4)
fig, ax = plt.subplots(figsize=fig_dims)
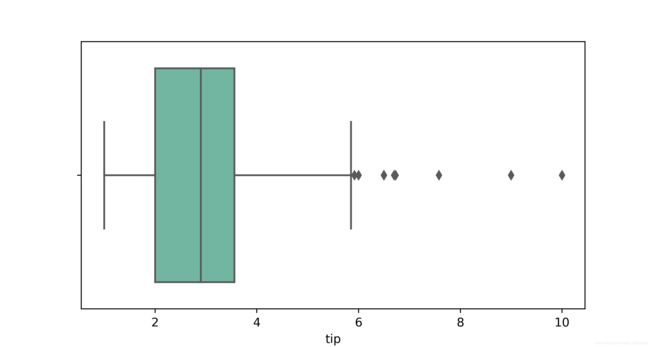
fig = sns.boxplot(x = data['tip'], data = data, ax = ax, orient = "h", palette = "Set2")
plt.show()
boxplot = fig.get_figure()
boxplot.savefig(fig_path, dpi=400)
其中,
fig_dims = (7.5, 4) 为控制箱型图的大小;
sns.boxplot()为绘制箱型图的方法。
4. Heatmap 热力图
绘图与保存的方法:
x = np.array([[1,2,3,4], [2,3,4,6], [10,2,3,6], [8,9,7,3]])
fig_name = 'heatmap.png'
fig_path = filepath + '/' + fig_name
fig = sns.heatmap(x, annot = True)
heatmap = fig.get_figure()
heatmap.savefig(fig_path, dpi = 400)
其中, sns.heatmap()为绘制热力图的方法。
5. Pairplot 多变量图
绘图与保存的方法:
iris = sns.load_dataset("iris")
pairplot_fig = sns.pairplot(iris, kind = 'scatter', hue="species", palette="Set2",
                                height=2.5, plot_kws=dict(s=50, alpha=0.4))
pairplot_fig.savefig(fig_path, dpi = 400)
其中,
sns.pairplot()为绘制多变量图的方法,里面的plot_kws = dict(s = 50, alpha = 0.4)为控制多变量的散点大小与颜色的透明度。
注意: 在.pairplot()中是没有.get_figure()方法的。在保存多变量图时,直接调用.savefig()方法。
结果图:
总结
对于散点图、频率分布图、箱型图、热力图,都可以使用.get_figure()和.savefig()来保存图片,而多变量图只需要使用savefig()来保存图片。
参考链接
Pairplot 多变量图
Heatmap 热力图
Scatterplot 散点图
Boxplot 箱型图
Distplot 频率分布图


