使用Python绘制数据中心网络拓扑
本文采用Python语言,借助networkx, matplotlib实现三种典型数据中心网络拓扑的绘制与可视化。三种数据中心网络拓扑为Fat-tree, BCube, Vl2。
拓扑生成
在开始之前,引入相关的包:
import matplotlib.pyplot as plt
import networkx as nx
- Fat-tree
def fat_tree_topo(n=4):
    """Standard fat tree topology
    n: number of pods
    total n^3/4 servers
    """
    topo = nx.Graph()
    num_of_servers_per_edge_switch = n // 2
    num_of_edge_switches = n // 2
    num_of_aggregation_switches = num_of_edge_switches
    num_of_core_switches = int((n / 2) * (n / 2))

    # generate topo pod by pod
    for i in range(n):
        for j in range(num_of_edge_switches):
            topo.add_node("Pod {} edge switch {}".format(i, j))
            topo.add_node("Pod {} aggregation switch {}".format(i, j))
            for k in range(num_of_servers_per_edge_switch):
                topo.add_node("Pod {} edge switch {} server {}".format(
                    i, j, k))
                topo.add_edge(
                    "Pod {} edge switch {}".format(i, j),
                    "Pod {} edge switch {} server {}".format(i, j, k))

    # add edge among edge and aggregation switch within pod
    for i in range(n):
        for j in range(num_of_aggregation_switches):
            for k in range(num_of_edge_switches):
                topo.add_edge("Pod {} aggregation switch {}".format(i, j),
                              "Pod {} edge switch {}".format(i, k))

    # add edge among core and aggregation switch
    num_of_core_switches_connected_to_same_aggregation_switch = num_of_core_switches // num_of_aggregation_switches
    for i in range(num_of_core_switches):
        topo.add_node("Core switch {}".format(i))
        aggregation_switch_index_in_pod = i // num_of_core_switches_connected_to_same_aggregation_switch
        for j in range(n):
            topo.add_edge(
                "Core switch {}".format(i),
                "Pod {} aggregation switch {}".format(
                    j, aggregation_switch_index_in_pod))

    topo.name = 'fattree'

    return topo
- BCube
def bcube_topo(k=0, n=4):
    """Standard Bcube topology
    k: layers
    n: num of servers
    total n ^ (k+1) servers
    """
    topo = nx.Graph()
    num_of_servers = n**(k + 1)
    # add server first
    for i in range(num_of_servers):
        topo.add_node("Server {}".format(i))

    # add switch by layer
    num_of_switches = int(num_of_servers / n)
    for i in range(k + 1):
        index_interval = n**i
        num_of_one_group_switches = n**i
        for j in range(num_of_switches):
            topo.add_node("Layer {} Switch {}".format(i, j))
            start_index_server = j % num_of_one_group_switches + (
                j // num_of_one_group_switches) * num_of_one_group_switches * n
            for k in range(n):
                server_index = start_index_server + k * index_interval
                topo.add_edge("Server {}".format(server_index),
                              "Layer {} Switch {}".format(i, j))

    topo.name = 'Bcube'

    return topo
- Vl2
def vl2_topo(port_num_of_aggregation_switch=4, port_num_of_tor_for_server=2):
    """Standard vl2 topology
    total port_num_of_aggregation_switch^2 / 4 * port_num_of_tor_for_server servers
    """
    topo = nx.Graph()
    num_of_aggregation_switches = port_num_of_aggregation_switch
    num_of_intermediate_switches = num_of_aggregation_switches // 2
    num_of_tor_switches = (port_num_of_aggregation_switch //
                           2) * (port_num_of_aggregation_switch // 2)

    # create intermediate switch
    for i in range(num_of_intermediate_switches):
        topo.add_node("Intermediate switch {}".format(i))

    # create aggregation switch
    for i in range(num_of_aggregation_switches):
        topo.add_node("Aggregation switch {}".format(i))
        for j in range(num_of_intermediate_switches):
            topo.add_edge("Aggregation switch {}".format(i),
                          "Intermediate switch {}".format(j))

    # create ToR switch
    num_of_tor_switches_per_aggregation_switch_can_connect = num_of_aggregation_switches // 2
    for i in range(num_of_tor_switches):
        topo.add_node("ToR switch {}".format(i))
        # every ToR only need to connect 2 aggregation switch
        aggregation_index = (
            i // num_of_tor_switches_per_aggregation_switch_can_connect) * 2
        topo.add_edge("ToR switch {}".format(i),
                      "Aggregation switch {}".format(aggregation_index))
        aggregation_index += 1  # The second aggregation switch
        topo.add_edge("ToR switch {}".format(i),
                      "Aggregation switch {}".format(aggregation_index))
        # add server to ToR
        for j in range(port_num_of_tor_for_server):
            topo.add_node("ToR switch {} server {}".format(i, j))
            topo.add_edge("ToR switch {} server {}".format(i, j),
                          "ToR switch {}".format(i))

    topo.name = 'VL2'

    return topo
说明:在以上代码中用了较多很长的变量名,这是为了让读者更容易理解代码的含义。在实际使用中,可适当精简变量的命名。
代码测试
- Fat-tree
topo = fat_tree_topo()
nx.draw(topo, with_labels=True)
plt.show()

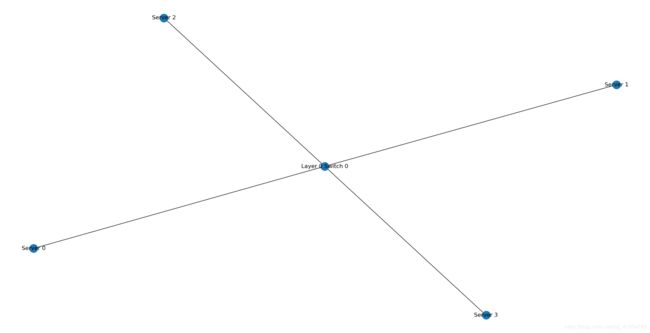
- BCube
topo = bcube_topo()
nx.draw(topo, with_labels=True)
plt.show()
- Vl2
topo = vl2_topo()
nx.draw(topo, with_labels=True)
plt.show()

参考资料
在本文中没有详细介绍三种网络拓扑的具体结构等内容,详细的介绍可以在以下文章中找到:
A Survey of Data Center Network Architectures(链接:https://pdfs.semanticscholar.org/676b/f0c711107389f0452553ed0c3c59921db4e5.pdf).