网上租房数据的爬取与分析
主要介绍租房书爬取与分析过程中用到的相关技术,爬虫所用开发语言为python,开发环境anaconda,用beautifulsoup解析网页,数据处理numpy,可视化展示matplotlib,所用数据库为mangodb。
一.数据爬取
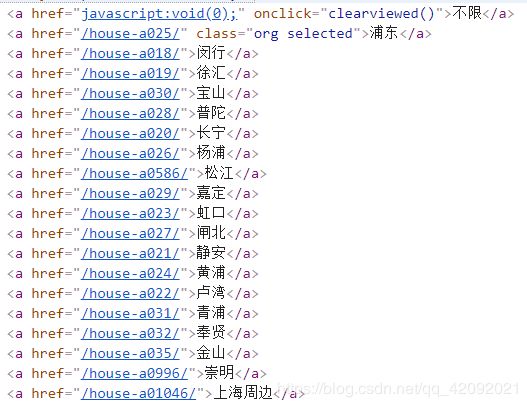
urlDir = {
        #"不限": "/house/",
        "浦东": "/house-a025/",
        "闵行": "/house-a018/",
        "徐汇": "/house-a019/",
        "宝山": "/house-a030/",
        "普陀": "/house-a028/",
        "杨浦": "/house-a026/",
        "松江": "/house-a0586/",
        "嘉定": "/house-a029/",
        "虹口": "/house-a023/",
        "闸北": "/house-a027/",
        "静安": "/house-a021/",
        "黄浦": "/house-a024/",
        "卢湾": "/house-a022/",
        "青浦": "/house-a031/",
        "奉贤": "/house-a032/",
        "长宁": "/house-a020/",
        "金山": "/house-a035/",
        "崇明": "/house-a0996/",
        "上海周边": "/house-a01046/",
    }
- 网页下载
class HouseSpider:
        def getAreaList(self):
                return [  # "不限",
                        "浦东", "徐汇", "宝山", "普陀", "长宁", "杨浦", "松江",
                        "嘉定", "虹口", "闸北", "黄浦", "卢湾", "青浦", "奉贤",
                        "金山", "崇明", "闵行", "静安", "上海周边"]

        def getOnePageData(self, pageUrl, reginon="浦东"):
            rent = self.getCollection(self.region)
            self.session.headers.update({
                'User-Agent': 'Mozilla/5.0 (Macintosh; Intel Mac OS X 10_13_3) AppleWebKit/537.36 (KHTML, like Gecko) Chrome/68.0.3440.84 Safari/537.36'})
            res = self.session.get(
                pageUrl
            )

        # 设置区域
        def setRegion(self, region):
                self.region = region

        # 设置页数
        def setPage(self, page):
                self.page = page

        def startSpicder(self):
                for url in self.getRegionUrl(self.region, self.page):
                        self.getOnePageData(url, self.region)
                        print("*" * 30 + "one page 分割线" + "*" * 30)
                        time.sleep(3)
spider = HouseSpider()
spider.setPage(100)# 设置爬取页数
for i in range(0,20):
            spider.setRegion(spider.getAreaList()[i]) # 设置爬取区域
            spider.startSpicder()
- 网页解析部分
soup = BeautifulSoup(res.text, "html.parser")
# 获取需要爬取得 div
divs = soup.find_all("dd", attrs={"class": "info rel"})

for div in divs:
    ps = div.find_all("p")
    try:  # 捕获异常
        for index, p in enumerate(ps):
            text = p.text.strip()
            print(text)
        print("===================================")
        # 爬取并存进 MongoDB 数据库
        roomMsg = ps[1].text.split("|")
        # rentMsg 防止空值
        area = roomMsg[2].strip()[:len(roomMsg[2]) - 2]
        # 标题 房间数 平方数 价格 地址 交通描述 区 房子朝向
        rentMsg = self.getRentMsg(
            ps[0].text.strip(),
            roomMsg[1].strip(),
            int(float(area)),
            int(ps[len(ps) - 1].text.strip()[:len(ps[len(ps) - 1].text.strip()) - 3]),
            ps[2].text.strip(),
            ps[3].text.strip(),
            ps[2].text.strip()[:2],
            roomMsg[3],
        )
        # 插入到数据库中
        rent.insert(rentMsg)
    except:
        continue
- 存储功能设计
def __init__(self):
        self.client = MongoClient('mongodb://localhost:27017/')
        self.shzfdata = self.client.shzfdata
# MongoDB 存储数据结构
def getRentMsg(self, title, rooms, area, price, address, traffic, region, direction):
    return {
        "title": title,  # 标题
        "rooms": rooms,  # 房间数
        "area": area,  # 平方数
        "price": price,  # 价格
        "address": address,  # 地址
        "traffic": traffic,  # 交通描述
        "region": region,  # 区、(福田区、南山区)
        "direction": direction,  # 房子朝向(朝南、朝南北)
    }
# 获取数据库 collection
def getCollection(self, name):
    shzfdata = self.shzfdata
    if name == "浦东":
        return shzfdata.pudong
    if name == "闵行":
        return shzfdata.minhang
    if name == "徐汇":
        return shzfdata.xihui
    if name == "宝山":
        return shzfdata.baoshan
    。。。。。
到此为止,数据爬取部分完成,爬取数据1.5W条。
二. 数据分析
- 地址转换经纬度
结构化地址转化为经纬度需要借助百度地图API,百度地图Web服务API为开发者提供http/https接口,即开发者通过http/https形式发起检索请求,获取返回json或xml格式的检索数据。用户可以基于此开发JavaScript、C#、C++、Java等语言的地图应用。本文将使用百度地图API的正地理编码服务提供将结构化地址数据(如:北京市海淀区上地十街十号)转换为对应坐标点(经纬度)功能。
正地理编码的接口为:http://api.map.baidu.com/geocoder/v2/?address=北京市海淀区上地十街10号&output=json&ak=您的ak&callback=showLocation ,其中ak,address为必须参数
转换代码:
from urllib.request import urlopen, quote
from pymongo import MongoClient
import json
import codecs
import sys
import os

path = sys.path[0] + os.sep

def getlnglat(address):
    """根据传入地名参数获取经纬度"""
    url = 'http://api.map.baidu.com/geocoder/v2/'
    output = 'json'
    ak = '***********************************' # 浏览器端密钥
    address = quote(address)
    uri = url + '?' + 'address=' + address  + '&output=' + output + '&ak=' + ak
    req = urlopen(uri)
    res = req.read().decode()
    temp = json.loads(res)
    lat = temp['result']['location']['lat']
    lng = temp['result']['location']['lng']
    return lat, lng

def jsondump(outfilename, dic):
    """传入保存路径和字典参数,保存数据到对应的文件中"""
    with codecs.open(path + outfilename + '.json', 'a', 'utf-8') as outfile:
        json.dump(dic, outfile, ensure_ascii=False)
        outfile.write('\n')

def convertfile(filename):
    file = codecs.open(path + filename, 'r', encoding='utf-8')
    outfilename = 'loc' + filename
    for line in file:
        dic = json.loads(line.strip())
        address = dic['地址']
        dic['lat'], dic['lng'] = getlnglat(address)
        jsondump(outfilename, dic)

def convertmongodb(host, dbname, collname):
    '''连接mongodb, 并根据其位置字段得到其坐标信息,进而更新数据库'''
    client = MongoClient('mongodb://localhost:27017/')
    db = client[dbname]
    collection = db[collname]
    for dic in collection.find():
        dic['lat'], dic['lng'] = getlnglat(dic['address'])
        collection.save(dic) # 更新数据,并覆盖相同_id的记录
    print (dic)

if __name__ == '__main__':
    filename = 'E:\Code\Python\test1\test.json'
    # convertfile(filename)
    host = '*********************' # 需要连接的数据库所在ip
    dbname = 'databackup'
    collname = 'allinfo' #allinfo是合并所有数据表所得的所有数据
    convertmongodb(host, dbname, collname)
- 数据展示
(1)数据读入dataframe
import pandas as pd
import numpy as np
import pymongo
client = pymongo.MongoClient("mongodb://localhost:27017/",connect=False)
db = client["databackup"]
table = db["allinfo"]
df = pd.DataFrame(list(table.find()))
(2)上海租房平均价格
import matplotlib.pyplot as plt
from pylab import mpl
mpl.rcParams['font.sans-serif'] = ['FangSong']
mpl.rcParams['axes.unicode_minus'] = False

price = df['price']
max_price = price.max()
min_price = price.min()
mean_price = price.mean()
median_price = price.median()

print("上海市租房最高价格:%.2f元/平方米" % max_price)
print("上海市租房最低价格:%.2f元/平方米" % min_price)
print("上海市租房平均价格:%.2f元/平方米" % mean_price)
print("上海市租房中位数价格:%.2f元/平方米" % median_price)

% matplotlib
inline

plt.rcParams['font.sans-serif'] = ['SimHei']
plt.rcParams['axes.unicode_minus'] = False

mean_price_per_region = df.groupby(df.region)

fig = plt.figure(figsize=(12, 7))
ax = fig.add_subplot(111)

ax.set_title('上海租房平均价格')
mean_price_per_region.price.mean().plot.bar()
输出结果
上海市租房最高价格:1800000.00
上海市租房最低价格:100.00
上海市租房平均价格:8977.88
上海市租房中位数价格:5500.00

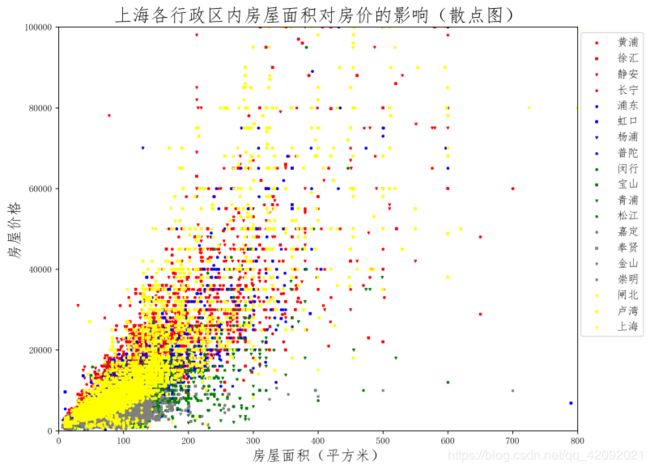
(3)上海各行政区内房屋面积对房价的影响(散点图)
def plot_scatter():
    plt.figure(figsize=(10, 8), dpi=256)
    colors = ['red', 'red', 'red', 'red',
              'blue', 'blue', 'blue', 'blue',
              'green', 'green', 'green', 'green',
              'gray', 'gray', 'gray', 'gray',
              'yellow', 'yellow', 'yellow', 'yellow']
    region = ['黄浦', '徐汇', '静安', '长宁',
              '浦东', '虹口', '杨浦', '普陀',
              '闵行', '宝山', '青浦', '松江',
              '嘉定', '奉贤', '金山', '崇明',
              '闸北', '卢湾', '上海']
    markers = ['o', 's', 'v', 'x',
               'o', 's', 'v', 'x',
               'o', 's', 'v', 'x',
               'o', 's', 'v', 'x',
               'o', 's', 'v']
    print(region)
    for i in range(19):
        x = df.loc[df['region'] == region[i]]['area']
        y = df.loc[df['region'] == region[i]]['price']
        plt.scatter(x, y, c=colors[i], s=5, label=region[i], marker=markers[i])

    plt.legend(loc=1, bbox_to_anchor=(1.138, 1.0), fontsize=12)
    plt.xlim(0, 800)
    plt.ylim(0, 100000)
    plt.title('上海各行政区内房屋面积对房价的影响(散点图)', fontsize=20)
    plt.xlabel('房屋面积(平方米)', fontsize=16)
    plt.ylabel('房屋价格', fontsize=16)
    plt.show()
plot_scatter()
['黄浦', '徐汇', '静安', '长宁', '浦东', '虹口', '杨浦', '普陀', '闵行', '宝山', '青浦', '松江', '嘉定', '奉贤', '金山', '崇明', '闸北', '卢湾', '上海']
from scipy import optimize
# 直线函数方程
def linearfitting(x, A, B):
    return A * x + B
def plot_line():
    plt.figure(figsize=(10, 8), dpi=256)
    colors = ['red', 'red', 'red', 'red',
              'blue', 'blue', 'blue', 'blue',
              'green', 'green', 'green', 'green',
              'gray', 'gray', 'gray', 'gray',
              'yellow', 'yellow', 'yellow', 'yellow']
    region = ['黄浦', '徐汇', '静安', '长宁',
              '浦东', '虹口', '杨浦', '普陀',
              '闵行', '宝山', '青浦', '松江',
              '嘉定', '奉贤', '金山', '崇明',
              '闸北', '卢湾', '上海']
    markers = ['o', 's', 'v', 'x',
               'o', 's', 'v', 'x',
               'o', 's', 'v', 'x',
               'o', 's', 'v', 'x',
               'o', 's', 'v']
    for i in range(19):
        x = df.loc[df['region'] == region[i]]['area']
        y = df.loc[df['region'] == region[i]]['price']
        A, B = optimize.curve_fit(linearfitting, x, y)[0]
        xx = np.arange(0, 2000, 100)
        yy = A * xx + B
        plt.plot(xx, yy, c=colors[i], marker=markers[i], label=region[i], linewidth=2)
    plt.legend(loc=1, bbox_to_anchor=(1.138, 1.0), fontsize=12)
    plt.xlim(0, 800)
    plt.ylim(0, 100000)
    plt.title('上海各行政区内房屋面积对房价的影响(线性拟合)', fontsize=20)
    plt.xlabel('房屋面积(平方米)', fontsize=16)
    plt.ylabel('房屋价格', fontsize=16)
    plt.show()
plot_line()
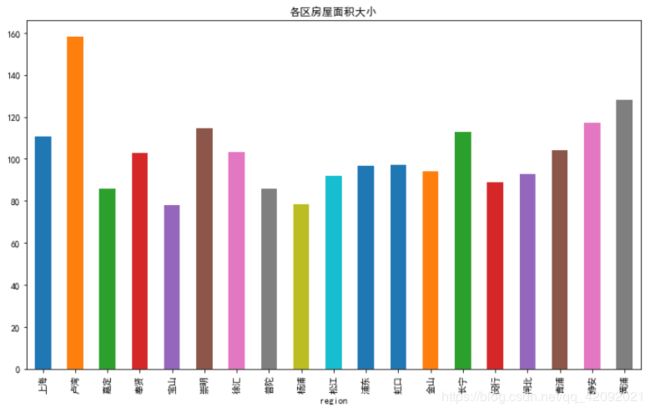
df.area = df.area.astype(np.float)
fig = plt.figure(figsize=(12, 7))
ax = fig.add_subplot(111)
df.groupby('region').area.mean().plot.bar()
plt.title("各区房屋面积大小")
fig = plt.figure(figsize=(8, 8))
ax = fig.add_subplot(111)
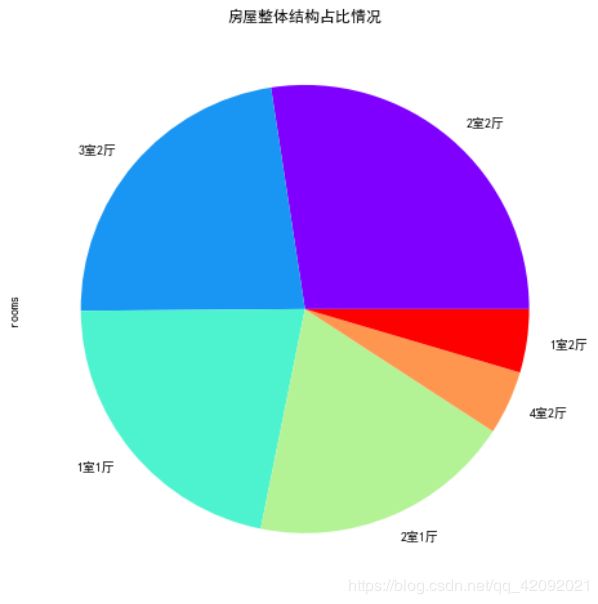
df['rooms'].value_counts()[:6].plot.pie(cmap=plt.cm.rainbow)
plt.title('房屋整体结构占比情况')
fig = plt.figure(figsize=(12,7))
ax = fig.add_subplot(111)
df.direction.value_counts()[:10].plot.bar()
plt.title('房源朝向分布情况')
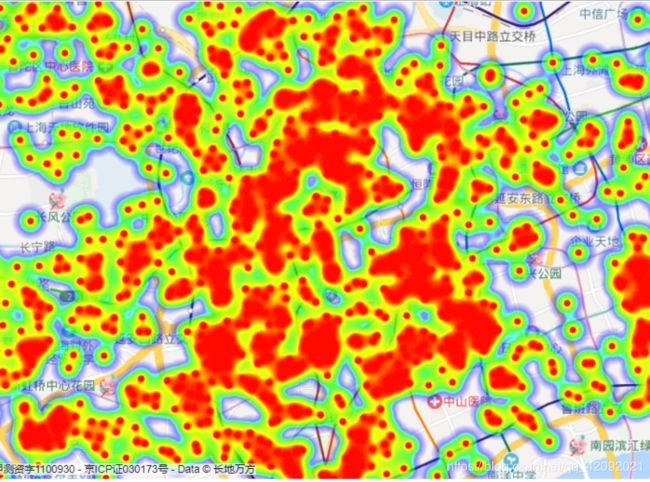
热力图功能示例
var points =[
{“lat”:31.32940203,“lng”:121.4524398,“count”:3000},
{“lat”:30.74623653,“lng”:120.7754725,“count”:11500},
{“lat”:30.73972623,“lng”:120.8048763,“count”:50000},
];
var points 中导入所有数据1.5W条,其中lat,lng是地址转换的经纬度,count权重取价格。
百度热力图
