Matlab2013学习之四种定位技术(TOA、TDOA、RSSI测距、RSSI指纹)
首先,这几种定位是跟着老师提供的思路做的,对于将其修改成python语言,还没有完成。
至于各种定位原理,有太多人介绍了,就不逐一介绍了。
文章目录
- 一、TOA定位算法性能仿真
- 1.1、toa定位要求
- 1.2、toa定位代码
- 1.2、toa实现效果
- 二、TDOA定位算法性能仿真
- 2.1、tdoa定位要求
- 2.2、tdoa定位代码
- 2.3、tdoa实现效果
- 三、RSSI测距定位技术性能仿真
- 3.1、rssi测距定位要求
- 3.2、rssi测距定位代码
- 3.3、rssi测距实现效果
- 四、RSSI指纹定位技术性能仿真
- 4.1、rssi指纹定位要求
- 4.2、rssi指纹定位代码
- 4.3、rssi指纹实现效果
一、TOA定位算法性能仿真
1.1、toa定位要求
要求一:编写两个函数TOA_LLOP和TOA_CHAN得到位置的估计。
要求二:用RMSE实现两种算法的性能比较, 得到两种算法的RMSE曲线对比图,横坐标为噪声方差,纵坐标为RMSE。
1.2、toa定位代码
TOA:
% %% the simulation of TOA localization algorithm
clear all;
clc;
%接收机的位置坐标,简单实验就可采用少量样本,精准实验必须采用大量样本数量
BS1=[0,0];
BS2=[500,0];
BS3=[500,500];
%BS4=[0,500];
%BS5=[800,800];
MS=[250,250]; %移动台MS的估计位置
std_var=[1e-2,1e-1,1,1e1,1e2]; %范围矩阵
%A=[BS1;BS2;BS3;BS4];  %矩阵A包含基站的坐标
A=[BS1;BS2;BS3];
%A=[BS1;BS2;BS3;BS4;BS5];
number=10000;
for j=1:length(std_var) %从1循环到std_var的长度
    error1=0;%初始误差为0
    error2=0; %初始误差为0
    std_var1=std_var(j);
 for i=1:number   %多次循环
    %r1=A-ones(4,1)*MS;  %矩阵A减去4*1的全一矩阵乘以MS
    r1=A-ones(3,1)*MS;
    %r1=A-ones(5,1)*MS;
    r2=sum(r1.^2,2); %矩阵r1每个元素分别平方,得到新矩阵,在行求和,最为矩阵r2
    %r=r2.^(1/2)+std_var1*randn(4,1); %从移动到位置MS发射信号到达基站i的TOA测量值
    r=r2.^(1/2)+std_var1*randn(3,1);
    %r=r2.^(1/2)+std_var1*randn(5,1);
    theta1=TOALLOP(A,r,1); % 调用TOALLOP函数
    theta2=TOACHAN(A,r,std_var1^2); % 调用TOACHAN函数
    error1=error1+norm(MS-theta1)^2; %norm是返回MS-theta1的最大奇异值,即max(svd(MS-theta1)),
    error2=error2+norm(MS-theta2)^2; %移动台MS估计位置与计算的到的距离的平方
 end
   RMSE1(j)=(error1/number)^(1/2); %求TOALLOP均方根误差
   RMSE2(j)=(error2/number)^(1/2);%求TOACHAN均方根误差
end
% plot
semilogx(std_var,RMSE1,'-O',std_var,RMSE2,'-s') %x轴取对数,X轴范围是1e-2到1e2,Y轴的范围是变动的
xlabel('测量噪声标准差(m) ');
legend('TOALLOP','TOACHAN');
ylabel('RMSE');
legend('TOA-LLOP','TOA-CHAN')

TOALLOP:
function theta=TOALLOP(A,p,j)
 % A is the coordinate of BSs
 %A是BBS的坐标
% p is the range measurement
%P是范围测量
% j is the index of reference BS
%J是参考BS的索引
[m,~]=size(A);  %size得到A的行列数赋值给[m,~],~表示占位,就是只要行m的值!
k=sum(A.^2,2);%矩阵A每个元素分别平方,得到新矩阵,在行求和,最为矩阵K
k1=k([1:j-1,j+1:m],:); %取出J行
A1=A([1:j-1,j+1:m],:); %取出J行
A2=A1-ones(m-1,1)*A(j,:); %得到D,就是j行与其余行对应值相减
p1=p([1:j-1,j+1:m],:); %取出J行
p2=p(j).^2*ones(m-1,1)-p1.^2-(k(j)*ones(m-1,1)-k1); %得到b,(Rn*Rn-R1*R1-Kn+K1)其中Kn为对应第n个x^2+y^2
theta=1/2*inv(A2'*A2)*A2'*p2; %利用最小二乘解,得
theta=theta';%转换为(x,y)形式

TOACHAN:
function theta=TOACHAN(A,p,sigma)
% A is the coordinate of BSs
%A是BBS的坐标
% p is the range measurement
%P是范围测量
% sigma is the the variance of TOA measurement
%sigma是TOA测量的方差
[m,~]=size(A); %size得到A的行列数赋值给[m,~],~表示占位,就是只要行m的值!
k=sum(A.^2,2); %矩阵A每个元素分别平方,得到新矩阵,在行求和,最为矩阵K
A1=[-2*A,ones(m,1)]; %-2乘以矩阵A与一个m*1的全一矩阵,组成新矩阵A1,也就是Gn
p1=p.^2-k; %得到h
B1=diag(2*p);%得到B,基站与移动台的真实值
Q1=diag(ones(m,1)*sigma); %TOA协方差矩阵
cov1=B1*Q1*B1; %由于B1中有2,此处就可以省略4
theta1=inv(A1'*inv(cov1)*A1)*A1'*inv(cov1)*p1; %得到Za,因为B中包含MS与个基站之间的距离,Q1是未知量,需进一步近似
cov_theta1=inv(A1'*inv(cov1)*A1); %上式采用扰动算法得
A2=[1,0;0,1;1,1]; %得到Ga‘
p2=[theta1(1,1)^2;
theta1(2,1)^2;
theta1(3,1)]; %得到h‘
B2=diag([2*theta1(1,1);
2*theta1(2,1);1]); %得到B’
cov2=B2*cov_theta1*B2; %误差向量的协方差矩阵
theta2=inv(A2'*inv(cov2)*A2)*A2'*inv(cov2)*p2; %运用最大似然估计得到
theta=sign(theta1(1:2,:)).*theta2.^(1/2); %得到MS位置的估计值坐标,以及符号
theta=theta';%转换为(x,y)形式
1.2、toa实现效果
二、TDOA定位算法性能仿真
2.1、tdoa定位要求
要求一:编写两个函数TDOA_CHAN和TDOA_Taylor得到位置的估计。
要求二:用RMSE实现两种算法的性能比较, 得到两种算法的RMSE曲线对比图,横坐标为噪声方差,纵坐标为RMSE。
2.2、tdoa定位代码
TDOA部分:
% %% the simulation of TDOA localization algorithm
clear all;
clc;
%定义四个参与基站的坐标位置
BS1=[0,0];
BS2=[500,0];
BS3=[500,500];
BS4=[0,500];
%BS5=[600,500];
%移动台MS的初始估计位置
MS=[550,150];
std_var=[1e-2,5e-2,1e-1,5e-1,1]; %范围
%A=[BS1;BS2;BS3;BS4]; %矩阵A包含4个初始坐标
A=[BS1;BS2;BS3;BS4];
number=10000;
for j=1:length(std_var) %循环
    error1=0;%初始误差置为0
    error2=0; %初始误差置为0
    std_var1=std_var(j);%令std_var1等于当前数组的值
    for i=1:number %多次循环
          %r1=A-ones(4,1)*MS;
          r1=A-ones(4,1)*MS;
          r2=(sum(r1.^2,2)).^(1/2);
          %r=r2(2:end,:)-ones(3,1)*r2(1,:)+std_var1*randn(3,1); %表示从[2,i]开始MS与基站i和基站1的距离差
          r=r2(2:end,:)-ones(3,1)*r2(1,:)+std_var1*randn(3,1);
          sigma=std_var1^2;
          theta1=TDOACHAN(A,r,sigma); % 调用TDOACHAN函数
          theta2=TDOATaylor(A,r,sigma); %调用TDOATalor函数
          error1=error1+norm(MS-theta1)^2; %移动台MS估计位置与计算的到的距离的平方
          error2=error2+norm(MS-theta2)^2; %移动台MS估计位置与计算的到的距离的平方
      end
      RMSE1(j)=(error1/number)^(1/2); %均方根误差
      RMSE2(j)=(error2/number)^(1/2); %均方根误差
end
% plot
semilogx(std_var,RMSE1,'-O',std_var,RMSE2,'-s')% x轴取对数,X轴范围是1e-2到1,Y轴的范围是变动的
xlabel('The standard deviation of measurement noise (m)');
ylabel('RMSE');
legend('TDOA-CHAN','TDOA-Taylor');

TDOA-CHAN:
function theta=TDOACHAN(A,p,sigma)
% A is the coordinate of BSs
%A是BSS的坐标
% p is the range measurement
%P是范围测量
% sigma is the the variance of TDOA measurement
%sigma是TDOA测量的方差
[m,~]=size(A); %size得到A的行列数赋值给[m,~],~表示占位,就是只要行m的值!
k=sum(A.^2,2); %矩阵A每个元素分别平方,得到新矩阵,在行求和,最为矩阵K
G1=[A(2:end,:)-ones(m-1,1)*A(1,:),p]; %得到Xm1,Ym1,Rm1,的值,m取值[2,i],构建矩阵Ga
h1=1/2*(p.^2-k(2:end,:)+ones(m-1,1)*k(1,:)); %构建矩阵h
Q=diag(ones(m-1,1)*sigma); %构建TDOA的协方差矩阵
% initial estimate
theta0=inv(G1'*inv(Q)*G1)*G1'*inv(Q)*h1; %通过一次WLS算法进行求解,
s=A(2:end,:)-ones(m-1,1)*theta0(1:2,:)';
d=sum(s.^2,2);%矩阵s每个元素分别平方,得到新矩阵,在行求和,最为矩阵d
B1=diag(d.^(1/2));
cov1=B1*Q*B1;
% first wls
theta1=inv(G1'*inv(cov1)*G1)*G1'*inv(cov1)*h1; %进行第一次WLS计算
cov_theta1=inv(G1'*inv(cov1)*G1); %得到theta1的协方差矩阵
% second wls
G2=[1,0;0,1;1,1]; %构建G'
h2=[(theta1(1,1)-A(1,1))^2;(theta1(2,1)-A(1,2))^2;theta1(3,1)^2]; %构建h'
B2=diag([theta1(1,1)-A(1,1),theta1(2,1)-A(1,2),theta1(3,1)]); %构建b'
cov2=4*B2*cov_theta1*B2; %得到误差矢量的协方差矩阵。
theta2=inv(G2'*inv(cov2)*G2)*G2'*inv(cov2)*h2; %运用最大似然估计得到
theta=theta2.^(1/2)+[A(1,1);A(1,2)]; %得到MS位置的估计值坐标,以及符号
theta=theta';%转换为(x,y)形式
TDOA-Talayor:
function theta=TDOATaylor(A,p,sigma)
% A is the coordinate of BSs
 % p is the range measurement
% sigma is the the variance of TOA measurement
% initial estimate
theta0=TDOACHAN(A,p,sigma); %调用TDOACHAN得到一个初始的估计位置
delta=norm(theta0); %得到范数
while norm(delta)>1e-2 %得到足够小的值
       [m,~]=size(A); %size得到A的行列数赋值给[m,~],~表示占位,就是只要行m的值!
       d=sum((A-ones(m,1)*theta0).^2,2);
       R=d.^(1/2);
       G1=ones(m-1,1)*(A(1,1)-theta0(1,1))/R(1,1)-(A(2:m,1)-theta0(1,1))./R(2:m,:);
       G2=ones(m-1,1)*(A(1,2)-theta0(1,2))/R(1,1)-(A(2:m,2)-theta0(1,2))./R(2:m,:);
       G=[G1,G2]; %构建Gt
       h=p-(R(2:m,:)-ones(m-1,1)*R(1,:)); %构建Ht
       Q=diag(ones(m-1,1)*sigma); %TDOA测量值的协方差矩阵
       delta=inv(G'*inv(Q)*G)*G'*inv(Q)*h; %加权最小二乘解
       theta0=theta0+delta'; %累加
end
theta=theta0;
2.3、tdoa实现效果
三、RSSI测距定位技术性能仿真
3.1、rssi测距定位要求
要求一:RSSI的测量值由对数路径损耗模型产生,为减小波动造成的误差,其值可由多次测量取平均值来得到。
要求二:对数路径损耗模型中的参考距离路径损耗和路径损耗因子可通过参考点相互之间的测量值估计。
要求三:完成理想情况下(参考距离路径损耗和路径损耗因子已知)与实际情况下的RMSE曲线对比图,横坐标为噪声方差,纵坐标为RMSE。
3.2、rssi测距定位代码
RSSI:
% %% the simulation of RSSI localization algorithm
clear all;
clc;
BS1=[0,0];
BS2=[500,0];
BS3=[500,500];
BS4=[0,500];
MS=[100,100];
std_var=[0,2,4,6];
A=[BS1;BS2;BS3;BS4];
number=300;
pd0=0;
n=3;
tt=5;
% the number of RSSI measurement for each BS
for j=1:length(std_var)
    error1=0;
    error2=0;
    std_var1=std_var(j);
    for i=1:number
        r1=A-ones(4,1)*MS;
        r2=(sum(r1.^2,2)).^(1/2);
        for k=1:tt
            rssi(:,k)=pd0-10*n*log10(r2)-10^(std_var1/10)*randn(4,1);
        end
        RSSI1=mean(rssi,2);
        % ideal situation
        r1=10.^((RSSI1-pd0)/(-10*n));
        % real situation
        [p_est,n_est]=parameter_est(A,std_var1);
        r2=10.^((RSSI1-p_est)/(-10*n_est));
        theta1=TOALLOP(A,r1,1);
        theta2=TOALLOP(A,r2,1);
        error1=error1+norm(MS-theta1)^2;
        error2=error2+norm(MS-theta2)^2;
    end
    RMSE1(j)=(error1/number)^(1/2);
    RMSE2(j)=(error2/number)^(1/2);
end
% plot
plot(std_var,RMSE1,'-O',std_var,RMSE2,'-s')
xlabel('The standard deviation of RSS measurement (db)');
ylabel('RMSE');
legend('Ideal','Real');

parameter_est部分:
function [pd0_est,n_est]=parameter_est(A,sigma)
% A is the coordinate of BSs
% sigma is the standard deviation of RSSI measurement
[m,~]=size(A);
pd0=0;
n=3;
d=zeros(m,m);
tt=5;
% the number of RSSI measurement for each BS
sigma1=10^(sigma/10);
h1=[];
G1=[];
for i=1:m
    for j=1:m
        if i~=j
           d(i,j)=norm(A(i,:)-A(j,:));
           for k=1:tt
               prd(k)=pd0-10*n*log10(d(i,j))-sigma1*randn;
           end
           RSSI=mean(prd);
           d_distance=-10*log10(d(i,j));
           h1=[h1;RSSI];
           G1=[G1;d_distance];
        end
     end
end
h=h1;
[m1,~]=size(h);
G=[ones(m1,1),G1];
x=inv(G'*G)*G'*h;
pd0_est=x(1,1);
n_est=x(2,1);
end

TOALLOP部分:
function theta=TOALLOP(A,p,j)
 % A is the coordinate of BSs
 %A是BBS的坐标
% p is the range measurement
%P是范围测量
% j is the index of reference BS
%J是参考BS的索引
[m,~]=size(A);  %size得到A的行列数赋值给[m,~],~表示占位,就是只要行m的值!
k=sum(A.^2,2);%矩阵A每个元素分别平方,得到新矩阵,在行求和,最为矩阵K
k1=k([1:j-1,j+1:m],:); %取出J行
A1=A([1:j-1,j+1:m],:); %取出J行
A2=A1-ones(m-1,1)*A(j,:); %得到D,就是j行与其余行对应值相减
p1=p([1:j-1,j+1:m],:); %取出J行
p2=p(j).^2*ones(m-1,1)-p1.^2-(k(j)*ones(m-1,1)-k1); %得到b,(Rn*Rn-R1*R1-Kn+K1)其中Kn为对应第n个x^2+y^2
theta=1/2*inv(A2'*A2)*A2'*p2; %利用最小二乘解,得
theta=theta';%转换为(x,y)形式
3.3、rssi测距实现效果
四、RSSI指纹定位技术性能仿真
4.1、rssi指纹定位要求
要求一:RSSI的测量值由对数路径损耗模型产生,为减小波动造成的误差,其值可由多次测量取平均值来得到。
要求二:定位指纹数据库的建立是基于网格形式产生不同的指纹节点。
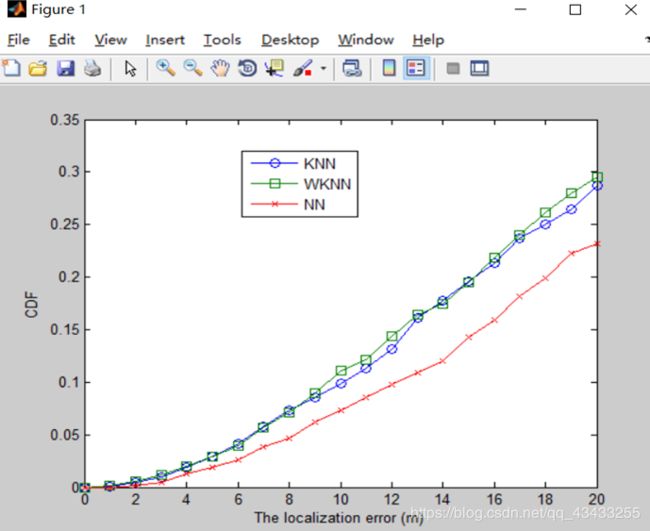
要求三: 比较KNN算法与WKNN算法的CDF曲线对比图,横坐标为定位误差,纵坐标为CDF。
4.2、rssi指纹定位代码
RSSIone部分:
clear all;
clc;
BS1=[0,0];
BS2=[500,0];
BS3=[500,500];
BS4=[0,500];
std_var=4;
A=[BS1;BS2;BS3;BS4];
pd0=0;
n=3;
tt=5;
% the number of RSSI measurement for each BS
number=1000;
for i=1:number
    MS=[400*rand,400*rand];
    r1=A-ones(4,1)*MS;
    r2=(sum(r1.^2,2)).^(1/2);
    for k=1:tt
        rssi(:,k)=pd0-10*n*log10(r2)-10^(std_var/10)*randn(4,1);
    end
    RSSIoone=mean(rssi,2);
    %database
    X=databaseone(A,std_var);
    %matching
    [m,~]=size(X);
    for j=1:m
        distance(j)=norm(X(j,3:end)-RSSIoone');
    end
    [C,I]=sort(distance);
    %KNN algorithm
    K=3;
    match_result=X(I(1:K),1:2);
    est1=mean(match_result);
    RMSE1(i)=norm(est1-MS);
    %WKNN algorithm
    weight=1./C(1:K);
    weight=weight'/sum(weight);
    est2=sum([weight.*match_result(:,1),weight.*match_result(:,2)]);
    RMSE2(i)=norm(est2-MS);
    est3=X(I(1),1:2);
    RMSE3(i)=norm(est3-MS);
end
RMSE=0:20;
for i=1:length(RMSE)
    n1=0;
    n2=0;
    n3=0;
    for j=1:number-5
        if RMSE1(j)<=RMSE(i)
            n1=n1+1;
        end
        if RMSE2(j)<=RMSE(i)
            n2=n2+1;
        end
        if RMSE3(j)<=RMSE(i)
            n3=n3+1;
        end
    end
    p1(i)=n1/number;
    p2(i)=n2/number;
    p3(i)=n3/number;
end
% plot
plot(RMSE,p1,'-O',RMSE,p2,'-s',RMSE,p3,'-x')
xlabel('The localization error (m)');
ylabel('CDF');
legend('KNN','WKNN','NN');

databaseone部分:
function [X]=databaseone(A,sigma)
% A is the coordinate of BSS
% sigma is the standard deviation of RSSI measurement
pd0=0;
n=3;
[m,~]=size(A);
tt=5;
coor=[];
RSSIone=[];
for i=20:20:480
    for j=20:20:480
        coor1=[i,j];
        coor=[coor;coor1];
        d1=A-ones(m,1)*coor1;
        d2=sum(d1.^2,2);
        d=d2.^(1/2);
        for k=1:tt
            rssi(:,k)=pd0-10*n*log10(d)-10^(sigma/10)*randn(m,1);
        end
        RSS_m=mean(rssi,2)';
        RSSIone=[RSSIone;RSS_m];
    end
end
X=[coor,RSSIone];


