多项式回归 Polynomial Regression
前面介绍了线性拟合数据的情况。那么,当数据并不符合线性规律而是更复杂的时候应该怎么办呢?
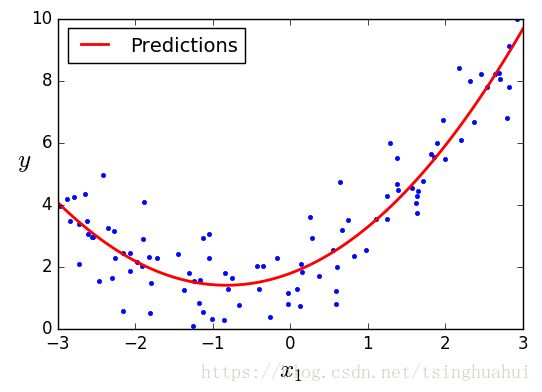
一种简单的解决方法就是将每一维特征的幂次添加为新的特征,再对所有的特征进行线性回归分析。这种方法就是 多项式回归。
具体做法可以从示例代码中体会一下。。。
注意
当存在多维特征时,多项式回归能够发现特征之间的相互关系,这是因为在添加新特征的时候,添加的是所有特征的排列组合。
以Scikit-Learn 中的PolynomialFeatures类为例,当原始特征为a,b,次幂为3时,不仅仅会将 a3,b3 a 3 , b 3 作为新特征,还会添加 a2b,ab2 a 2 b , a b 2 和 ab a b 。
PolynomialFeatures(degree=d) P o l y n o m i a l F e a t u r e s ( d e g r e e = d ) 将维度为 n n 的原始特征转换为维度为 (n+d)!d!n! ( n + d ) ! d ! n ! 的新特征( n! n ! 表示 n n 的阶乘),因此,在使用 PolynomialFeatures 的时候,必须注意 特征维度爆炸 的问题。
关于 (n+d)!d!n! ( n + d ) ! d ! n ! 的求解
考虑 n n 维特征( x1,x2,…,xn x 1 , x 2 , … , x n ), d d 次幂的情况:
1a0xa11xa22⋯xann 1 a 0 x 1 a 1 x 2 a 2 ⋯ x n a n
有:
a0+a1+⋯+an=d a 0 + a 1 + ⋯ + a n = d
其中, a0,a1,⋯,an a 0 , a 1 , ⋯ , a n 为非负整数。因此该问题转换为了求上式非负整数解个数的问题。
即相当于:将d个相同小球排成一排后,用n个隔板将其进行分割,组合数学告诉我们共有 Cnn+d=(n+d)!d!n! C n + d n = ( n + d ) ! d ! n ! 种方法。
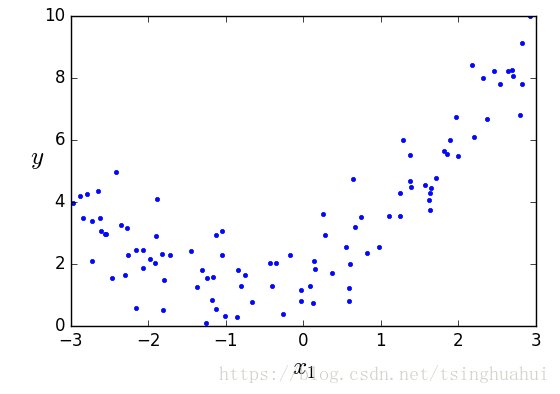
## 生成一些非线性数据
import numpy as np
# import numpy.random as rnd
np.random.seed(42)

m = 100
X = 6 * np.random.rand(m, 1) - 3
y = 0.5 * X**2 + X + 2 + np.random.randn(m, 1)

plt.plot(X, y, "b.")
plt.xlabel("$x_1$", fontsize=18)
plt.ylabel("$y$", rotation=0, fontsize=18)
plt.axis([-3, 3, 0, 10])
plt.show()
## use Scikit-Learn PolynomialFeature class:
from sklearn.preprocessing import PolynomialFeatures
poly_features = PolynomialFeatures(degree=2, include_bias=False)
X_poly = poly_features.fit_transform(X) # a,b,degree=2: [a, b, a^2, ab, b^2]
# a,b,degree=3: [a, b, a^2, ab, b^2, a^3, a^2b, ab^2, b^3]
# a,b,c,degree=3: [a, b, c, a^2, ab, ac, b^2, bc, c^2, a^3, a^2b, a^2c, ab^2, ac^2, abc, b^3, b^2c, bc^2, c^3]
print(X[0])
print(X_poly[0])
from sklearn.linear_model import LinearRegression
lin_reg = LinearRegression()
lin_reg.fit(X_poly, y)
print(lin_reg.intercept_, lin_reg.coef_)# output
[-0.75275929]
[-0.75275929 0.56664654]
[ 1.78134581] [[ 0.93366893 0.56456263]]# 画出预测的曲线
X_new=np.linspace(-3, 3, 100).reshape(100, 1)
X_new_poly = poly_features.transform(X_new)
y_new = lin_reg.predict(X_new_poly)
plt.plot(X, y, "b.")
plt.plot(X_new, y_new, "r-", linewidth=2, label="Predictions")
plt.xlabel("$x_1$", fontsize=18)
plt.ylabel("$y$", rotation=0, fontsize=18)
plt.legend(loc="upper left", fontsize=14)
plt.axis([-3, 3, 0, 10])
plt.show()
