统计学习方法课后习题
- 第2章 感知机
- 2.1
- 第三章 K近邻算法
- 3.1
- 3.3
- 第五章
- 5.1
- 5.2
- 第6章 逻辑斯谛回归与最大熵模型
- 6.2
- 第七章 支持向量机
- 7.2
第2章 感知机
2.1
模仿例题2.1,构建从训练数据求解感知机模型的例子。
例题 2.1 的数据集如下:
x = [3 3; 4 3; 1 1];
y = [1; 1; -1];
感知机的训练过程为:
(1)选取初值w和b
(2)从训练集中选取数据
(3)如果
(4)转至(2),直到训练集中没有误分类点
import numpy as np

def hypothesis(w,x,b):
    a = np.dot(w, x.T) + b
    a[a<=0] = -1
    a[a>0] = 1
    return a


def training(x,y,eta):
    sample_count = len(x)
    feature_count = len(x[1])
    w = np.zeros(feature_count)
    b = 0;
    miss = sum(hypothesis(w, x, b) != y)
    i = 0
    while miss > 0:
        xi=x[i,:]
        yi=y[i]
        if ((np.dot(w, xi.T) + b)*yi <= 0):
            w = w + eta * yi * xi
            b = b + eta * yi
            print(w)
            print(b)
            print(hypothesis(w, x, b))
            miss = sum(hypothesis(w, x, b) != y)
            print("miss:", miss)
            print("---------")
        else:
            i = (i + 1) % sample_count
    return w, b


if __name__ == '__main__':
    x = np.array([[3,3],[4,3],[1,1]])
    y=np.array([1,1,-1])
    (w, b) = training(x,y,0.1)
    print(w)
    print(b)
感知机训练结果如下:
if __name__ == '__main__':
    x = np.array([[3,3],[4,3],[1,1]])
    y=np.array([1,1,-1])
    (w, b) = training(x,y,0.1)
    print(w)
    print(b)
结果如下:
[0.1 0.1]
-0.30000000000000004
第三章 K近邻算法
3.1
参照图 3.1,在 二维空间中给出实例点,画出 k 为 1 和 2 时的 K 近邻法构成的空间划分,并对其进行比较,体会 K 值选择与模型复杂度及预测准确率的关系。
3.3
参照算法 3.3,写出输出为 x 的 K 近邻的算法。
在寻找最近邻节点的时候需要维护一个”当前最近点“,而寻找 K 近邻的时候,就需要维护一个”当前 K近邻点集“。首先定义一个”当前 K 近邻点集“插入新点操作:如果”当前 K近邻点集“元素数量小于K,那么直接将新点插入集合;如果”当前 K近邻点集“元素数量等于K,那么将新节点替换原来集合中最远的节点。
在 kd 树中找出包含目标点 x 的叶结点:从根结点出发,递归地向下访问树。若目标点 x当前维的坐标小于切分点的坐标,则移动到左子结点,否则移动到右子结点,直到子结点为叶结点为止;
如果”当前 K 近邻点集“元素数量小于K或者叶节点距离小于”当前 K 近邻点集“中最远点距离,那么将叶节点插入”当前 K 近邻点集“;
递归地向上回退,在每个结点进行以下操作:
(a) 如果”当前 K 近邻点集“元素数量小于K或者当前节点距离小于”当前 K 近邻点集“中最远点距离,那么将该节点插入”当前 K 近邻点集“,
(b) 检查另一子结点对应的区域是否与以目标点为球心、以目标点与于”当前 K近邻点集“中最远点间的距离为半径的超球体相交。如果相交,可能在另一个子结点对应的区域内存在距目标点更近的点,移动到另一个子结点 . 接着,递归地进行最近邻搜索;如果不相交,向上回退;当回退到根结点时,搜索结束,最后的”当前 K 近邻点集“即为 x 的 K 近邻点集。
第五章
5.1
根据表 5.1 所给的训练数据集,利用信息增益比(C4.5 算法)生成决策树。
数值比字符串更容易处理,所以在学习过程中需要将字符串映射到数值:
| 特征(编号) | 0 | 1 | 2 |
|---|---|---|---|
| 年龄(0) | 青年 | 中年 | 老年 |
| 有工作(1) | 否 | 是 | |
| 有自己的房子(2) | 否 | 是 | |
| 信贷情况(3) | 一般 | 好 | 非常好 |
| 类别 | 否 | 是 |
训练数据集:
x = [[0,0,0,0],
     [0,0,0,1],
     [0,1,0,1],
     [0,1,1,0],
     [0,0,0,0],
     [1,0,0,0],
     [1,0,0,1],
     [1,1,1,1],
     [1,0,1,2],
     [1,0,1,2],
     [2,0,1,2],
     [2,0,1,1],
     [2,1,0,1],
     [2,1,0,2],
     [2,0,0,0]
     ];
y = [0, 0, 1, 1, 0, 0, 0, 1, 1, 1, 1, 1, 1, 1, 0];
计算数据集D的经验熵方法为:
计算特征A对数据集D的经验条件熵H(D|A):
计算信息增益比:
其中
# encoding: utf-8
import numpy as np
import math


def entropy(y):
    """
    求数据集的熵:H(D)
    :param y:
    :return:
    """
    ans = 0;
    out_values = np.unique(y)
    for i in range(len(out_values)):
        pi = sum(y == out_values[i]) / len(y)
        ans -= pi*math.log2(pi)
    return ans


def H_A(x, y, feature_index):
    """
    求H_A(D)
    :param x:
    :param y:
    :param feature_index:
    :return:
    """
    ans = 0;
    out_values = np.unique(x[:, feature_index])
    for i in range(len(out_values)):
        pi = sum(x[:, feature_index] == out_values[i])/len(x)
        ans -= pi * math.log2(pi)
    return ans

def entropycond(x, y, feature_index):
    """
    求条件熵 H(D|A)
    :param x: ndarray
    :param y: ndarray
    :param feature_index: int,当前特征下标
    :return:
    """
    ans = 0
    feature_values = np.unique(x[:, feature_index])
    for i in range(len(feature_values)):
        feature_value = feature_values[i]
        subset_index = np.where(x[:, feature_index] == feature_value)
        ans += len(subset_index)/len(y)*entropy(y[subset_index])
    return ans

def entropyincr(x,y,feature_index):
    """
    求信息增益比  g_R(D,A)=g(D,A)/H_A(D)=(H(D)-H(D,A))/H_A(D)
    :param x:
    :param y:
    :param feature_index:
    :return:
    """
    # return entropy(y) - entropycond(x, y, feature_index)    # 信息增益
    return (entropy(y) - entropycond(x, y, feature_index))/H_A(x, y, feature_index)   # 信息增益率


def generate(x, y, feature_indicies, epsilon):
    """
    构建决策树
    :param x:
    :param y:
    :param feature_indicies: 特征下标
    :param epsilon: 可接受误差值
    :return:
    """
    if (len(feature_indicies) == 0):
        counts = np.bincount(y)
        ans = {"leaf":True, "output":np.argmax(counts)}
        return ans
    elif len(np.unique(y)) == 1:
        ans = {"leaf":True, "output":y[0]}
        return ans
    else:
        feature_number = 0 # 特征编号
        max_rate = -100;
        for i in range(len(feature_indicies)):  # 求信息增益最大的特征点
            rate = entropyincr(x, y, feature_indicies[i])
            if max_rate < rate:
                max_rate = rate
                feature_number = feature_indicies[i]
        if max_rate < epsilon:    # 小于最低误差值
            counts = np.bincount(y)
            ans = {"leaf": True, "output": np.argmax(counts)}
            return ans
        feature_values = np.unique(x[:, feature_number])  # 该特征所有可能的取值
        child = []
        feature_indicies1 = feature_indicies[np.where(feature_indicies != feature_number)] # 去除已经使用的特征
        for j in feature_values:
            subset = np.where(x[:, feature_number] == j)
            child.append(generate(x[subset], y[subset], feature_indicies1, epsilon))
        ans = {'leaf':False, 'feature':feature_name[feature_number], 'child':child}
    return ans

feature_name = ["年龄", "工作", "房子", "信贷"]

if __name__ == '__main__':
    x_1 = [[0, 0, 0, 0],
         [0, 0, 0, 1],
         [0, 1, 0, 1],
         [0, 1, 1, 0],
         [0, 0, 0, 0],
         [1, 0, 0, 0],
         [1, 0, 0, 1],
         [1, 1, 1, 1],
         [1, 0, 1, 2],
         [1, 0, 1, 2],
         [2, 0, 1, 2],
         [2, 0, 1, 1],
         [2, 1, 0, 1],
         [2, 1, 0, 2],
         [2, 0, 0, 0]
         ]
    y_1 = [0, 0, 1, 1, 0, 0, 0, 1, 1, 1, 1, 1, 1, 1, 0]
    x = np.array(x_1)
    y = np.array(y_1)
    feature = np.array([0, 1, 2, 3])
    ans = generate(x, y, feature, 0)
    print(ans)
结果如下:
{'leaf': False, 'feature': '工作', 'child': [{'leaf': False, 'feature': '房子', 'child': [{'leaf': True, 'output': 0}, {'leaf': True, 'output': 1}]}, {'leaf': True, 'output': 1}]}对应的树结构为:

(ps: 可以将代码中的信息增益率 换为信息增益,即为例5.3的结果。可以看到C4.5和ID3算法结果略有不同)
5.2
已知如表 5.2 所示的训练数据,试用平方误差损失准则生成一个二叉回归树。
训练数据集:
x = [1,2,3,4,5,6,7,8,9,10];
y = [4.50,4.75,4.91,5.34,5.80,7.05,7.90,8.23,8.70,9.00];
寻找最优切分变量j和最优切分点s的方法为:
其中, c1=ave(yi|xi∈R1(j,s)),c2=ave(yi|xi∈R2(j,s)) c 1 = a v e ( y i | x i ∈ R 1 ( j , s ) ) , c 2 = a v e ( y i | x i ∈ R 2 ( j , s ) )
最小二乘回归树生成算法过程如下:
在训练数据集所在的输入空间中,递归地将每个区域划分为两个子区域并决定每个子区域上的输出值,构建二叉决策树:
(1)选择最优切分变量 J 与切分点 s;
(2)用选定的对 (J,S) 划分区域并决定相应的输出值;
(3)继续对两个子区域调用步骤(1)(2)直至满足停止条件;
(4)将输入空间划分为 M 个区域 R1,R2,...,RM R 1 , R 2 , . . . , R M 生成决策树:
在具体实现中,停止条件可以是区域不可以再分,或者 minj,s[minc1∑x1∈R1(j,s)(yi−c1)2+minc2∑xi∈R2(j,s)(yi−c2)2] min j , s [ min c 1 ∑ x 1 ∈ R 1 ( j , s ) ( y i − c 1 ) 2 + min c 2 ∑ x i ∈ R 2 ( j , s ) ( y i − c 2 ) 2 ] 小于某个阈值;
# encoding: utf-8
import numpy as np


def divide(x, y, feature_count):
    cost = np.zeros((feature_count, len(x)))
    for i in range(feature_count):
        for k in range(len(x)):
            value = x[k, i]     # k行i列的特征值
            y1 = y[np.where(x[:, i] <= value)]
            c1 = np.mean(y1)
            y2 = y[np.where(x[:, i] > value)]
            c2 = np.mean(y2)
            y1[:] = y1[:]-c1
            y2[:] = y2[:]-c2
            cost[i, k]=np.sum(y1*y1) + np.sum(y2*y2)
    cost_index = np.where(cost == np.min(cost))
    j = cost_index[0][0]      # 选取第几个特征值
    s = cost_index[1][0]      # 选取特征值的切分点
    c1 = np.mean(y[np.where(x[:, j] <= x[s, j])])
    c2 = np.mean(y[np.where(x[:, j] > x[s, j])])
    return j, s, cost[cost_index], c1, c2

def fittree(x, y, feature_count, epsilon):
    (j, s, minval, c1, c2) = divide(x, y, feature_count)
    tree = {"feature":j, "value":x[s, j], "left": None, "right":None}
    if minval < epsilon or len(y[np.where(x[:, j] <= x[s, j])]) <= 1:
        tree["left"] = c1
    else:
        tree["left"] = fittree(x[np.where(x[:,j] <= x[s, j])], y[np.where(x[:,j] <= x[s, j])], feature_count, epsilon)
    if minval < epsilon or len(y[np.where(x[:,j] > s)]) <= 1:
        tree["right"] = c2
    else:
        tree["right"] = fittree(x[np.where(x[:, j] > x[s, j])], y[np.where(x[:, j] > x[s, j])], feature_count, epsilon)
    return tree

if __name__ == '__main__':
    x = np.array([[1, 2, 3, 4, 5, 6, 7, 8, 9, 10]]).T
    y = np.array([4.50, 4.75, 4.91, 5.34, 5.80, 7.05, 7.90, 8.23, 8.70, 9.00])
    print(fittree(x, y , 1, 0.2))
上述代码中的阈值设置为0.2,获得的结果为
{'feature': 0, 'value': 5, 'left': {'feature': 0, 'value': 3, 'left': 4.72, 'right': 5.57}, 'right': {'feature': 0, 'value': 7, 'left': {'feature': 0, 'value': 6, 'left': 7.05, 'right': 7.9}, 'right': {'feature': 0, 'value': 8, 'left': 8.23, 'right': 8.85}}}也就是:
第6章 逻辑斯谛回归与最大熵模型
6.2
写出逻辑斯谛回归模型学习的梯度下降算法。
对于逻辑斯谛模型,条件概率分布如下:
令 P(Y=1|x)=π(x),P(Y=0|x)=1−π(x) P ( Y = 1 | x ) = π ( x ) , P ( Y = 0 | x ) = 1 − π ( x )
对数似然函数为:
对L(w) 求极大值,得到w的估计值。 故问题变成以对数似然函数为目标函数的最优化化问题,可采用梯度上升法进行求解。
说明: 在逻辑斯蒂回归中,极大似然函数与极小化经验误差是等价的,根据李航博士《统计学习方法》中第一章第九页中有两个论断:
- 当模型是条件概率分布,损失函数是对数损失函数时,经验风险最小化就等价于极大似然估计。
- 当模型是条件概率分布、损失函数是对数损失函数、模型复杂度由模型的先验概率表示时,结构风险最小化就等价于最大后验概率估计
似然函数求偏导:
因为要求最大似然函数,此处使用随机梯度上升法,每次选择一个数据点,对w进行更新
算法流程:
(1)选取初值 w0 w 0
(2)在训练集中选取数据 (xi,yi) ( x i , y i )
(3)更新w:
(4)转至2,直到w变化范围在可接受范围内(或者到达指定的迭代次数)。
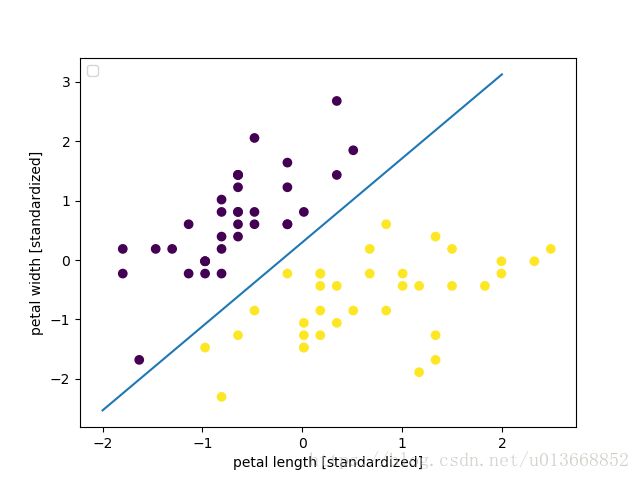
在实现中,采用的数据是iris,只保留分类为0-1的数据集,以进行二分类, 为了数据便于展示,数据集只取了两个特征。
- 先采用sklean实现下:
import numpy as np
import matplotlib.pyplot as plt
from sklearn.cross_validation import train_test_split
from sklearn import datasets

iris = datasets.load_iris()
X = iris.data
y = iris.target

# 去y=2的数据,使得成为一个二分类问题
X = X[y != 2]
y = y[y != 2]
X = X[:, (0, 1)]
print(X)

# X = np.loadtxt("logistic-data-train-x.txt")
# y = np.loadtxt("logistic-data-train-y.txt")

X_train, X_test, y_train, y_test = train_test_split(X, y, test_size=0.3, random_state=0)

from sklearn.preprocessing import StandardScaler
# 数据标准化,使得数据成为一个 mean为0,var = 1的标准数据集,数据标准化有利于快速收敛
sc = StandardScaler()
sc.fit(X_train)
X_train_std = sc.transform(X_train)
X_test_std = sc.transform(X_test)

# 训练
from sklearn.linear_model import LogisticRegression
# C是正则化系数λ的倒数,sklean中使用的是结构风险最小化,因此C取了10000,以尽可能的使得罚项的影响变小从而和经验误差最小化接近
lr = LogisticRegression(C=10000, random_state=0, solver='sag')
lr.fit(X_train_std, y_train)

# 测试集上进行测试
prepro = lr.predict_proba(X_test_std)
acc = lr.score(X_test_std,y_test)  # 在测试集上的准确率
# print(lr.predict_proba(X_test_std)) # 查看第一个测试样本属于各个类别的概率


# 绘图
print("w:", lr.coef_)
print("b:", lr.intercept_)
x_1 = range(-2, 3)
x_2 = -(x_1 * lr.coef_[0, 0] + lr.intercept_[0]) / lr.coef_[0, 1]
plt.plot(x_1, x_2)

plt.xlabel('petal length [standardized]')
plt.ylabel('petal width [standardized]')
plt.scatter(X_train_std[:, 0], X_train_std[:, 1], c=y_train)
plt.legend(loc='upper left')
plt.show()- 自己根据随机梯度下降求极大似然函数的方法进行了实现
# encoding: utf-8
import numpy as np
import math
import matplotlib.pyplot as plt
from sklearn import datasets


def logistic_gradient_descent(x, y, trail, alpha):
    """
    逻辑斯蒂 随机梯度下降
    :param x:
    形如[[1,2,3],
         [4,5,6]]
    :param y:
    :param trail: 迭代次数
    :param alpha: 步长
    :return:
    """
    w = np.zeros(x.shape[1])
    print(w)
    i = 0
    all_i = 1
    for index in range(trail):
        for j in range(len(w)):
            print(alpha * (y[i] * x[i, j] - (math.exp(w.dot(x[i].T)) * x[i, j])/(1 + math.exp(w.dot(x[i].T)))))
            w[j] = w[j] + alpha * (y[i] * x[i, j] - (math.exp(np.dot(w, x[i].T)) * x[i, j])/(1 + math.exp(np.dot(w, x[i].T))))
            print("第" , str(all_i) , "轮训练:w[" , str(j) , "]=", w[j])
        i = (i + 1) % x.shape[0]
        all_i += 1
    return w


if __name__ == '__main__':
    iris = datasets.load_iris()
    x = iris.data[:,(0, 1)]
    y = iris.target
    # 去y=2的数据,使得成为一个二分类问题
    x = x[y != 2]
    y = y[y != 2]

    # 数据标准化,使得数据成为一个 mean为0,var = 1的标准数据集,数据标准化有利于快速收敛
    from sklearn.preprocessing import StandardScaler
    sc = StandardScaler()
    sc.fit(x)
    x = sc.transform(x)

    # Plot also the training points
    plt.figure()
    plt.scatter(x[:, 0], x[:, 1], c=y)
    b = np.ones(len(x))
    x = np.c_[x,b]
    w = logistic_gradient_descent(x, y, 300, 0.01)
    print("参数", w)
    x_1 = range(-2, 3)
    x_2 = -(x_1 * w[0] + w[2]) / w[1]
    plt.plot(x_1, x_2)
    plt.show()
其结果如下:
- 对于使用sklean的结果:
w: [[11.42390645 -8.08671991]]
b: [2.39438857]参数 [ 0.74843831 -0.69781773 0.00339007]第七章 支持向量机
7.2
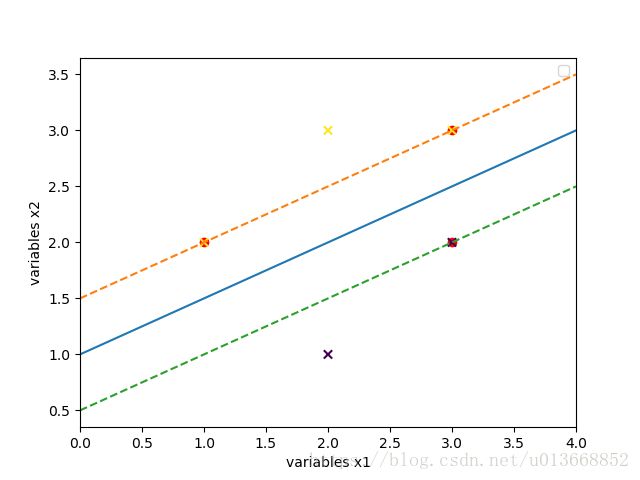
已知正例点 x1=(1,2)T,x2=(2,3)T,x3=(3,3)T x 1 = ( 1 , 2 ) T , x 2 = ( 2 , 3 ) T , x 3 = ( 3 , 3 ) T ,负例点: x4=(2,1)T,x5=(3,2)T x 4 = ( 2 , 1 ) T , x 5 = ( 3 , 2 ) T ,试求最大间隔分离超平面和分类决策函数,并在图上画出分离超平面、间隔边界及支持向量。
相对于其他的算法,支持向量机的实现实在是太过于复杂,因此此处需要借助scikit-learn.
from sklearn import svm
import matplotlib.pyplot as plt
import numpy as np

x = np.array([[1, 2],
             [2, 3],
             [3, 3],
             [2, 1],
             [3, 2]])
y = np.array([1, 1, 1, -1, -1])
# C是惩罚参数
clf = svm.SVC(kernel='linear', C=1000)
clf.fit(x, y)
print(clf.coef_)
print(clf.intercept_)
x_line = [0, 4]
y_line = [0, 0]
for i in range(len(x_line)):
    y_line[i] = -(clf.coef_[0, 0] * x_line[i] + clf.intercept_) / clf.coef_[0, 1]
plt.figure()
plt.scatter(clf.support_vectors_[:, 0], clf.support_vectors_[:, 1], c='r', marker="o")
plt.xlim([0, 4])
plt.scatter(x[:, 0], x[:, 1], c=y, marker="x")
plt.plot(x_line, y_line)

support_ = clf.support_
vector1 = -1
vector2 = -1
for i in support_:
    if y[i] == 1:
        vector1 = i
    else:
        vector2 = i

b1 = -(clf.coef_[0, 0] * x[vector1, 0] + clf.coef_[0, 1] * x[vector1, 1])
x_line1 = [0, 4]
y_line1 = [0, 0]
for i in range(len(x_line1)):
    y_line1[i] = -(clf.coef_[0, 0] * x_line1[i] + b1) / clf.coef_[0, 1]
plt.plot(x_line1, y_line1, lineStyle="--")

b2 = -(clf.coef_[0, 0] * x[vector2, 0] + clf.coef_[0, 1] * x[vector2, 1])
x_line2 = [0, 4]
y_line2 = [0, 0]
for i in range(len(x_line2)):
    y_line2[i] = -(clf.coef_[0, 0] * x_line2[i] + b2) / clf.coef_[0, 1]
plt.plot(x_line2, y_line2, lineStyle="--")

plt.xlabel('variables x1')
plt.ylabel('variables x2')
plt.legend(loc='upper right')
plt.show()
经计算后,得到的w和b结果为:
[[-1.  2.]]
[-2.]
因此分离超平面为: (−1,2)⋅x−2=0 ( − 1 , 2 ) ⋅ x − 2 = 0 ,决策函数为: f(x)=sign((−1,2)⋅x−2) f ( x ) = s i g n ( ( − 1 , 2 ) ⋅ x − 2 )


